Why the Grid Can't Keep Up, and Why that Drives Behind-The-Meter 50%+ of DCs/Year By 2028
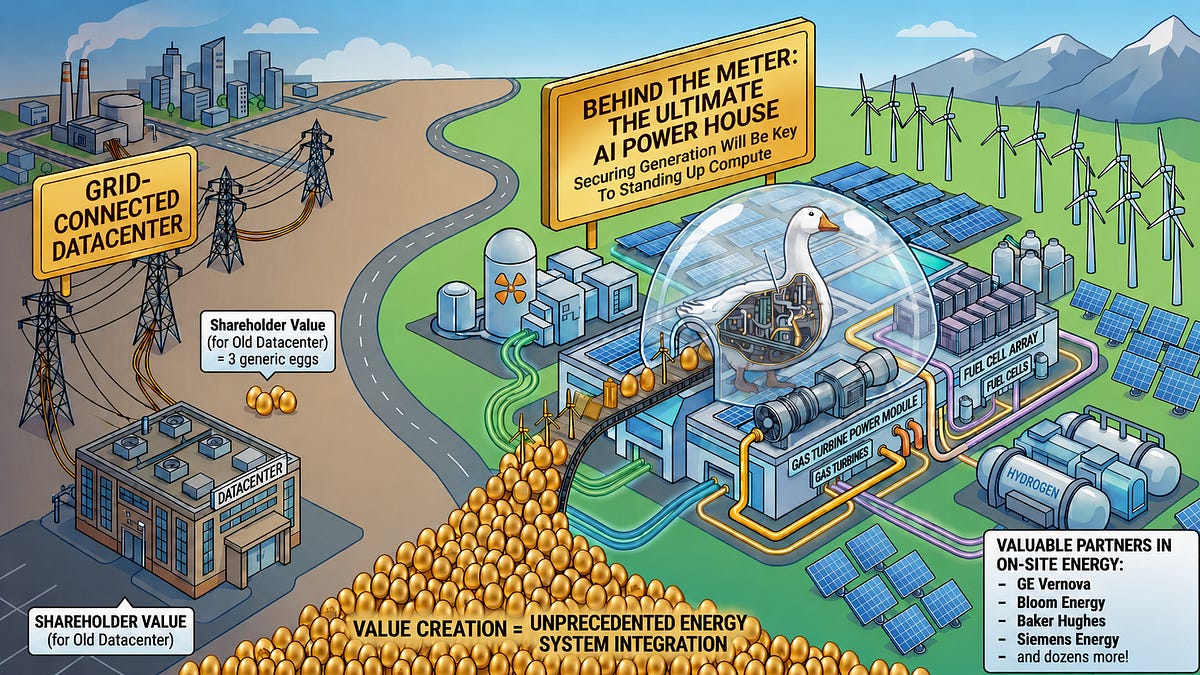
Today, the US grid is serving most datacenter load in the US, but we’re reaching a tipping point. As the insatiable demand for power of AI Labs and hyperscalers keeps accelerating, the grid simply can’t add capacity fast enough. That leaves Behind-The-Meter as the only way for the largest players to secure the power they need. Nearly a year ago, our Onsite Gas deep dive was the first to predict the fast rise of new entrants in the BTM gas equipment market. Since then, companies like Bloom Energy, Bergen Engines, Wärtsilä and many others have been remarkably successful. Overcoming GEV and Siemens turbine capacity constraints proved far easier than many had feared.
Today, we go deeper and model US Grid capacity to understand the shortfall that must be filled by Behind-The-Meter solutions for datacenters.
Let’s start with key numbers: first, we continue to see a record datacenter buildout in the US, going from +21GW in 2026 to +84GW by 2030. We explained in detail last week why Datacenter Delays headlines are often overblown.
Our research suggests that** BTM will power well over half of new US datacenters in 2028+, and the Total Addressable Market (TAM) for DC BTM equipment to cross 50GW/ year **by 2029. New Grid Capacity isn’t growing fast enough, and also needs to serve non-datacenter load growth.
The chart above shows the three core building blocks of our forecast: Expected Datacenter US Gross Power Demand, available US Grid Capacity, and New Grid Supply. We use the best of SemiAnalysis industry-leading insights to build this forecast.
The first block, datacenter demand, comes from a bottom-up forecast powered by a building-by-building model, supported by chip-by-chip AI demand forecast of the Accelerator Model, and validated by our Tokenomics Model which tracks the economics of the buildout and answers the “bubble” question.
The second building block of our Energy Model, grid headroom, analyzes supply & demand dynamics in each major part of the US grid. Our model follows the methodologies of all ISOs & RTOs and models UCAP/ICAP reserves, supply & demand growth, reliability risks, etc.
The third block forecasts new grid supply, through a bottom-up forecast produced by our new Energy Model. We track 40,000 generation assets in the US and forecast quarter by quarter Commercial Operation Date (COD) for all fuel types. We then estimate the “true” capacity value of power plants via our proprietary ELCC model, adapting to the specifics of each ISO and major non-ISO region.
Our forecast points to barely 15GW of net-new ELCC capacity being added annually, with a rising trend towards 20GW+ by the end of the decade. This is effectively all the firm capacity being added to the system that a grid operator can recognize to serve firm datacenter load - as well as other firm load like industrial plants, semiconductor fabs, etc.
Netting that accredited supply against peak demand and required reserve margins is what yields headroom itself, the spare accredited capacity a market has left to host new load after covering its own peak demand and required reserve margin. On this basis, available headroom is already approaching zero and turns negative by 2027, based on our analysis of required reserve margins across the country.
As such, we expect power generation to be a major bottleneck to grid-connected datacenter load growth (transmission is another one and will be the topic of a follow-up deep dive). All datacenter operators have already seen this firsthand: a utility tells you it can meet a 2027 load-ramp schedule, e.g., 500MW, and later comes back saying they can only deliver that load only in 2029 because the long-lead equipment grid interconnection requires, from main power transformers (MPTs) to high-voltage breakers and, in some cases, network upgrades, simply is not available any sooner. Worse, the burden increasingly falls on the buyer: securing grid-connected power now often requires developers to post substantial letters of credit, security deposits, or sign take-or-pay commitments to fund the generation built to serve their load. Switch Datacenter, for instance, closed a multi-billion-dollar performance letter-of-credit facility in 2026 to back exactly these obligations. And in many cases, despite billion-dollar commitments, the utilities don’t even face any penalties for not delivering on time.
These generation and transmission constraints, combined with inadequate market incentives, makes Behind-The-Meter often the most attractive solution for GW-scale newbuilds. And we’re already observing that many top-tier developers are planning 5GW+ behind-the-meter facilities in Texas, where permitting onsite gas is easier. Our Datacenter Model covers this in extreme detail, separating the few «real» 5GW+ campuses from those that show no sign of credible development under the hood.
This is, of course, a material tailwind for BTM solutions and providers. However, key beneficiaries aren’t the usual suspects. A few months ago, we were the first to flag the risk of temporary peak gas turbine orders. Read our Core Research report “Grid Power Bad, BTM Good” – Peak Gas Turbine Orders, IPPs Challenged, But Grid Equipment Demand Accelerating” for more details.
Our new Energy Model is the best tool to forecast and understand relative market positioning by company: we track manufacturing capacity, equipment lead times, installation lead times, major deal announcements, and much more. We’ve also covered recent secondary-market developments in depth, with notably surging turbine availability.
Let’s dig in. Our argument runs in three steps, and this report walks through them in order: grid supply is structurally constrained, that constraint pushes the marginal buyer behind the meter, and that shift reshuffles the winners and losers across equipment OEMs and IPPs as the market grows across fully islanded and hybrid BTM setups.
First, we establish the supply constraint: drawing on our new Energy Model, we explain how we forecast power-plant additions, how we estimate the true capacity value of each fuel via ELCC, and how we measure the grid headroom that results.
Next, we turn to the buyer’s decision: the relative attractiveness of BTM versus grid for the largest buyers of power and compute, broken down by use case.
Finally, we examine the practical bridge between them: the hybrid co-location structures emerging in ERCOT — codified by the Batch Zero process — that blend on-site generation with continued grid access, and where we think the early winners are taking shape. We explain more on this later.
Note that this article focuses on grid constraints and behind-the-meter as a solution, but there are alternatives, like Load Flexibility. These will be the focus of future deep dives, and out of scope for this one. We briefly explain later in this article why we think BTM will be the prominent solution over alternatives like Load Flexibility.
Forecasting Power Plants: No Gas Until 2028 #
Our analysis of 40k generators reveals one of the core challenges for the US grid: the lack of firm, dispatchable capacity added to the market over the next two years. Our nameplate capacity forecast shows that the US industry will add less than 10GW of gas per year in 2026 and 2027, with additions only picking up in 2028 and beyond.
To achieve this forecast, we replicate our Datacenter Model methodology: it starts with an extensive analysis of construction timelines, with hundreds of thousands of empirical datapoints analyzed, backed by real-time satellite imagery. We simply don’t see enough power plants in advanced construction stage that would enable a 2026-27 delivery.
The 2026–27 shortfall isn’t the product of one bottleneck but a stack of them. First, institutional and queue friction: the intrinsic slowness of key grid stakeholders like utilities, and overcrowded generation interconnection queues. In PJM, the queue itself is no longer the binding constraint — conversion is: roughly 57GW has cleared studies and been offered or executed interconnection agreements, yet since 2020 about 24GW of projects with fully executed agreements (including 13.5GW of gas) terminated before reaching commercial operation, largely due to permitting denials, supply-chain delays, and financing that could not close. Permitting alone accounted for 29% of project milestone changes between January 2023 and January 2026, versus 23% for supply-chain delays ( Powering Reliability through Market Design).
Second, the technology mix works against speed: the bulk of the gas capacity ordered by utilities is made up of CCGTs and combustion turbines. As we’ve explained in depth in our Onsite Gas deep dive, CCGTs are the most efficient way to burn gas for power, but their build is the slowest of any generation technology — construction and time from planning to COD run 4–6 years in some ISOs. Faster technologies like Fuel Cells and RICE are being aggressively secured directly by datacenter operators for onsite generation.
Third, the supply chain stretches every timeline further. Gas turbine and generator step-up transformer lead times have each extended to three to four years, versus a historical norm of roughly 18 months. That pushes total gas-plant development from a ~24-month baseline to at least four years even under optimistic assumptions, with CCGTs at the long end of the 4–6-year range.
Finally, a project may also slip for reasons beyond the plant itself such as increased equipment costs, community pushback, availability of labor, financing concerns, etc.
Renewables, Storage and ELCC #
Of course, gas isn’t the only fuel that matters for the US grid. Renewables and storage are taking on an increasing share, as our Energy Model tracks in great detail. We see solar and BESS each adding over 20GW nameplate per year in coming years, as shown in the chart above. However, from a grid perspective, their value is significantly lower. As shown below, on an ELCC basis (Effective Load Carrying Capability), their contribution is minimal. We’ll explain this concept in more depth just below.
For renewables, the cause is simple. Not only are these energy sources intermittent, they’re also highly correlated. Solar’s famous Duck Curve is the best example. As you add more solar to the system, the marginal value of adding new solar declines very sharply because all plants generate electricity at roughly the same hours. In ERCOT, the rapid build-out of solar and wind has compounded this by pulling the two price signals in opposite directions. The 4CP window — the four 15-minute intervals across June-September that set transmission charges for the following year — used to sit in the late-afternoon load peak. But as renewables flatten daytime net load, it has drifted later into the evening, closer to sunset. The curtailment peak has moved into the later hours of the day, when solar output falls off and the steep net-load ramp leaves the grid short of supply. The result is a wider, steeper evening ramp that batteries have to carry until gas can pick up. Quantifying this declining, weather-dependent value requires a dedicated metric. Utilities and grid planners rely on the concept of ELCC to do exactly that. ELCC estimates the ’true’ capacity value of a power plant to the overall system. It is also a useful gauge of available capacity headroom in a market: where excess ELCC capacity exists, the system has room to absorb a new large load, so a datacenter can interconnect — whereas a market without it does not. These entities think of their resources from a system perspective, and because each system is unique, each ELCC methodology is unique as well. Our Energy Model shows below how diverse solar ELCC is across regions.
Let’s pick a few examples to better understand how ELCC works and how it differs across regions.
PJM uses a complex formula called Marginal ELCC to account for the value of different energy resources. FERC accepted PJM’s shift to marginal ELCC accreditation in early 2024, replacing the prior Equivalent Forced Outage Rate (EFORd) method for thermal units and average ELCC for intermittent resources, alongside an hourly risk model that better captures correlated outages during extreme weather*.* For more details on PJM and some of their specificities, read our deep dive on PJM vs ERCOT market designs and their impact on household power prices.
Methodologies diverge sharply across markets. MISO accredits resources seasonally under its newer seasonal resource-adequacy construct, reflecting how scarcity risk concentrates differently in summer versus winter; ERCOT, an energy-only market with no centralized capacity market, relies on a reliability standard and its own effective-capacity measures rather than a centralized ELCC accreditation. The practical result is that the same solar or storage asset can be credited very differently depending on the ISO. ERCOT illustrates the extreme: in some congested zones and segregated transmission corridors, planners now leave solar’s capacity contribution out of local reliability modeling altogether — a de facto ‘no-solar scenario’ that credits incremental solar at essentially zero when sizing firm capacity needs.
Everything so far has concerned solar and wind. Storage is the other half of the renewables build-out — so what about BESS? Our forecast points to a rising penetration of 2hr and 4hr BESS, which naturally have a higher ELCC value than 1hr. Longer duration BESS has more room to provide relief to the system in times of constraints.
However, Storage also fundamentally suffers from declining marginal ELCC, and increasing duration doesn’t change that fact. The reason is that a given duration of BESS solves a specific pain point of the grid: for example, 4hr BESS increases the reliability of the grid for events with a duration of 4hrs or below. But as more 4hr BESS is added to the system, the <4hr grid risk becomes nullified, which reduces the value of incremental BESS. The grid reliability risks shift to >4hr events, which must be addressed by other fuels (or by 8hr+ BESS, which will initially have high ELCC, but will again see its ELCC decline as 8hr events get derisked). As a result, on most grids today incremental 4hr BESS adds little marginal ELCC.
Our point is not that renewables don’t matter, they are, and will remain, an important part of the AI buildout, just not its most important one. It is that nameplate badly overstates what they add to firm capacity: on an ELCC basis, each incremental GW of solar, wind, and storage is accredited at a steep and widening discount as the risk it addresses gets saturated. That gap between nameplate and accredited capacity is exactly what determines how much new load a market can actually host — which is the subject of the next section: grid headroom.
US Grid Headroom goes red by 2027 #
Grid headroom is the capacity a market has left to absorb new load once it has covered its own peak demand and required reserve margin. We model it subregion by subregion — each ISO and large non-ISO market — from local accredited supply and reserve requirements. Headroom goes “red” when a market’s reserve margin falls below its required target: at that point there is no spare accredited capacity to host an incremental large load like a datacenter without eroding reliability. Across a growing set of subregions, our analysis shows that threshold being crossed by 2027.
Fundamentally, the headroom calculation is simple: total accredited supply, minus peak demand, minus required reserves. As a live example, PJM’s 2027/2028 Base Residual Auction cleared roughly 134,478MW of unforced capacity (UCAP), yielding a 14.4% reserve margin against a 20% target — a physical deficit of about 6,517MW UCAP. The strain is not PJM-specific: NERC’s 2025 Long-Term Reliability Assessment flags 13 of 23 North American assessment areas as facing resource-adequacy shortfalls over the next decade. Required reserves are a regulatory artifact, set by either grid planners or vertically integrated utilities, depending on the territory, and can change year by year but tend to be fairly stable.
There are typically two types of reserve margins:
ICAP reserves: ICAP means Installed Capacity and is a proxy for nameplate capacity. A fairly common requirement across ISOs is 15-20% required ICAP reserves. PJM, for instance, sizes its capacity requirement to a 1-in-10 loss-of-load-expectation (LOLE) standard, which currently translates to an installed reserve margin (IRM) target of roughly 20%.UCAP reserves: the most critical for a true headroom calculation… but also sometimes biased by the policies of ISOs and utilities. UCAP means accredited capacity and incorporates the failure risk of dispatchable generation and the ELCC values of storage and renewables. Because it nets out both forced-outage risk on thermal units and the steep ELCC discounts on solar and storage, the UCAP view of headroom is materially tighter than the ICAP view — and it is the UCAP picture that turns red first.
Note that estimating true headroom is more complicated than that. Utilities themselves often struggle to understand their headroom, and the smartest datacenter developers can successfully navigate the environment by finding “hidden” headroom. We‘ll dig much deeper into this in the future deep dive.
Why BTM wins over grid-connected: speed and certainty of timelines are key #
With grid supply structurally constrained — too little firm capacity, too little effective capacity from renewables and storage, and vanishing headroom — the decision now sits with the buyer. And we think BTM is now the most attractive option. This statement might shock some stakeholders, but we base our view on the fundamental drivers of demand: AI labs. Companies like OpenAI, Anthropic now make up the bulk of demand, directly but also often indirectly as they represent a significant portion of the datacenter capacity added by companies like Amazon, Microsoft, and Oracle. Our Tokenomics and Datacenter models both quantify this quarter-by-quarter and have successfully called out major deals and shifts ahead of the headlines, such as the Anthropic TPU rise and the Oracle/OpenAI RPO surge.
The key advantage of BTM vs Grid is speed and certainty on the timeline of power. On speed, onsite generation can be energized in a fraction of the grid-interconnection timeline — requested BTM in-service dates cluster around 2027–28, against grid timelines that routinely slip toward 2030. On certainty, the schedule sits in the buyer’s hands rather than the utilities. As explained earlier, timelines provided by utilities are notoriously unreliable and they often push back or revise down the load that they promised datacenter operators… with little to no penalties at all.
This doesn’t work for AI Labs, for which access to large scale compute is the lifeblood of their business. They need power both to generate revenue (inference) and to fuel future revenue growth (training). In addition, as we cover in extreme depth in our AI Cloud TCO Model, power as a percent of total TCO is mostly insignificant, meaning that any amount of power secured by an AI Lab is actually worth billions. For example, our Tokenomics Model susbcribers know very well the margins Anthropic is currently making on API, and the implied tens of billions of dollars of annual revenue per GW. Given the cost of GW-scale DCs and revenue potential, it simply doesn’t work if it risks multi-year delay, or if the load-serving entity faces no symmetric dollar penalties for being delayed.
In the grid vs BTM debate, another key factor is redundancy and uptime, historically a major advantage provided by the grid. As explained in our Datacenter Electrical Systems deep dive, the playbook to reach five nines of uptime was simple, and came in two steps: first, connect to a substation with N+1 redundancy, which on its own delivers roughly three to four nines depending on assumptions; then add backup power covering more than 100% of nameplate load demand — backup generators and batteries — to close the gap to five nines.
However, AI labs and some hyperscalers have relaxed those requirements as there is now a lower uptime tolerance applied to both inference and training, not just training. Many of Meta’s self-built AI datacenters, for example, target just two nines of uptime and forgo backup generators entirely, as detailed in our Industrials Model.
Source: Meta Prometheus datacenter has no gensets; SemiAnalysis Industrials Model
This removes historical cost barriers to BTM adoption. As we alluded to in our onsite gas deep dive, the main challenge and driver of cost overrun is redundancy and reliability. The grid manages this at the macro level, while an onsite power plant must do it for the much narrower purpose of serving one (large) datacenter alone. Providing four or five nines of redundancy at a BTM site is a recipe for unbearable costs. But now that customers are willing to accept lower redundancy, the economics of grid vs BTM are much more balanced.
Nevertheless, practice varies — some operators add gensets to their BTM-to-FTM bridge builds, while many omit them altogether on a grid connected datacenter.
In our view, it can make sense to add gensets if you plan to connect to the grid in the near future and can redeploy the generation equipment elsewhere, or if you’re exploring a grid-connected BTM solution (more on this later). Most BTM sites are not planned to be islanded forever; they are bridges while the interconnection queue clears. However, if the queue is expected to clear — say 5 years from today — it’s hard to justify ~$1mm/MW in capex for a backup genset fleet, especially since the realized uptime gain is on the order of a single nine once human-factor and recovery-time failures (not power-source outages) are what actually dominate downtime.
Ultimately, the call comes down to the tenant’s design requests, SLAs, and how long the site expects to run off grid.
We’ve seen the following: Where BTM is a short bridge — on the order of two years or less to interconnection — operators tend to spec the gensets at initial build and project financing package, since grid energization and the backup role that follows are close at hand. Where a site expects to stay off-grid for far longer, or effectively permanently, that rationale weakens: primary on-site generation already carries the load with its own redundancy, so a grid-backup stack that sits idle for years is capex worth deferring. Meta is the clearest case — its Ohio campus is designed never to connect to the PJM grid, and its El Paso and Louisiana sites are built around dedicated, utility-scale gas rather than a near-term interconnection. We understand Cipher’s AWS-leased Black Pearl site and several of Fluidstack’s build-outs follow similar logic, deferring or skipping the genset-as-grid-backup route altogether.
Now, none of this means the grid is being written off and that the uptime and reliability requirements of a datacenter are no longer of importance. Rather, it reflects our view of how market participants are adapting to meet the rampant power needs of AI DCs – and it’s our view that tenants are becoming more lenient with these requirements as they have nowhere to go.
Also, there are many promising solutions to enable the grid to absorb more datacenter load growth, and we believe that would be the best outcome for all: lower power costs and higher reliability for everyone. Here are a few solutions outside of today’s article’s scope:
Load flexibility: if grid-connected DCs could curtail a determined amount of hours per year, tens of GWs could be easily unlocked. PJM characterizes this flexibility concretely as workload shifting, on-site backup-generation dispatch, and battery discharge, and notes it could bridge the gap while new generation clears interconnection queues and supply chains — provided it is integrated into market dispatch rather than accessible only through manual action during emergencies. We remain cautious in the near-term however, given commercial and regulatory constraints which slow down broad-based adoption. This topic is worth an entire SemiAnalysis dedicated deep dive.Interconnection Queue and market incentive reforms: a more capitalistic approach to the power buildout would likely trigger more risk-taking behavior by utilities. But it is an extremely tough balance of priorities between protecting American households and taking a directional bet on AI growth. We don’t foresee a big enough change anytime soon. Watching PJM’s struggles best exemplifies this: the various stakeholders can’t agree on the best solutions and end up making the whole process even slower than it already was. That said, there are early signs of reform. FERC moved first on the demand side: its December 2025 order directed PJM to create clear co-location rules and new transmission services for data centers sited at power plants, and — at the DOE’s direction — it opened a rulemaking (Docket RM26-4) on the faster interconnection of large loads above 20MW. PJM’s tariff has since followed: on June 12, 2026, FERC accepted revisions establishing an Expedited Interconnection Track (EIT), a roughly 10-month accelerated generator interconnection study process aimed at near-term resource adequacy after the 2027/2028 Base Residual Auction cleared about 6.6GW short of PJM’s reliability requirement. ERCOT’s shift to a batch-style large-load interconnection process is another attempt to bring more order here. We’ll dig into both in a forthcoming deep dive, alongside a load tracker that follows which datacenter loads we expect to firm up in the batch process.Renewed transmission buildout: building more transmission could enable both more generation and load growth, but that market remains over-regulated and slow. We think the 2030s will likely witness a major transmission buildout as the largest power offtakers become creditworthy enough — able to post parent guarantees — to offtake and underwrite whole transmission projects. But for now, building new bulk transmission is simply too slow for the pace of the AI buildout. In practice, only a handful of US transmission corridors could physically support load growth at this scale, and meeting NERC’s reliability requirements on the necessary timeline is itself a binding constraint.
All these topics will be covered by future SemiAnalysis energy deep dives. Stay tuned.
The Hybrid Structures Bridging BTM and Grid Interconnection in ERCOT and a likely Winner #
To deal with the limited grid headroom, the market is settling onto a spectrum of hybrid structures — particularly in ERCOT — that blend on-site generation with continued grid access, and this is where we’ve been observing a large share of deal activity and interest. Regulators are racing to write the rules, with FERC at the federal level and ERCOT and the PUCT in Texas updating their frameworks quickly.
In ERCOT, the Batch Zero process is codifying these structures. At its core is a single number for every large load — a maximum withdrawal limit, the amount the site may draw from the grid independent of any on-site generation. The governing framework (NPRR1325 and PGRR145, approved by the ERCOT board on June 1, 2026 and effective July 11) added two new co-location constructs alongside the long-established Private Use Network (PUN). The cleanest way to make sense of the landscape is to separate the two questions these structures answer: how a site interconnects and meters with the grid (as a PUN, WLPUN, or PCLR), and how it may sources its power (from existing generation under an NMA, newly built generation under BYOG). We take each in turn.
Powering your Datacenter
**NMA (Net-Metering Arrangement) — sourcing from existing generation. **An already-operating generator co-locates with a new large load and nets that load against its on-site output behind a single meter, so only the residual — what the load draws above what the co-located unit supplies — settles against the grid, with any surplus exported. The defining feature is vintage: the generator was already operating before September 1, 2025, the statutory trigger under Texas’s SB6. That brings the arrangement under regulatory review through ERCOT’s net-metering arrangement process (PUCT Project 39169) and a 120-day transmission security assessment. ERCOT studies the system impact — including the effect of pulling that capacity off the grid to serve the load — and the PUCT can approve, deny, or condition the arrangement, for instance by requiring the load to curtail during grid emergencies or the generator to make capacity available when the system is tight. Because the generation already exists and was already supporting the grid, the central regulatory question is whether re-pointing it to a private load leaves the rest of the system whole.
The bulk of announced ERCOT co-location activity to date sits in this existing-generation bucket. Below are a few datacenter examples — roughly 2,885 MW of reported projects in the co-location segment, with likely more beyond these.
Crusoe — Goodnight Campus (net-metering arrangement) Two load co-location agreements from the same POI (265.5 MW + 260 MW = 525.5 MW total) are expected to serve a ~1 GW IT campus.
Crusoe also has a TCEQ air-permit filing for up to 933 MW of gross nameplate gas generation, of which we expect ~665 MW is the 19x GE Vernova LM2500 turbines (~35 MW each)
AWS — Comanche Peak (net-metering arrangement) 1,200 MW co-located load adjacent to Vistra’s Comanche Peak nuclear plant (Somervell County); 20-year PPA, ramping to full capacity by 2032.
CyrusOne — Thad Hill Energy Center (net-metering arrangement)
Two phases — 190 MW (Phase 1) plus 210 MW (Phase 2), 400 MW total — adjacent to Calpine’s Thad Hill plant (Bosque County).
CyrusOne / Constellation — Freestone Energy Center (net-metering arrangement)
760 MW campus potential (380 MW contracted, with an exclusive option on a second 380 MW phase), via Calpine/Constellation.
**BYOG (Bring Your Own Generation) — sourcing from new generation. **Rather than wait on grid upgrades to serve its full load request, a large load builds, co-develops, or contracts new co-located generation to secure a near-term path to energization. ERCOT evaluates the project on three parallel tracks: a Batch Study sets the grid withdrawal limit (what the site may draw independent of on-site generation), Generation Interconnection sets the export limit (what the on-site units may push back to the grid), and Transmission Planning identifies any network upgrades required. The site’s achievable load is therefore its withdrawal limit plus available on-site generation, subject to system-stability limits, and energization is staged accordingly: the site draws up to its withdrawal limit (say, 100 MW) from day one and ramps toward full capacity as each generation unit comes online. The distinction from an NMA is one of category and vintage — BYOG describes how a site sources its power, by adding its own newly built generation, and because that generation is new it sits outside SB6’s net-metering review.
Metering & connecting your datacenter
A Private Use Network (PUN) places an entire campus — load plus its co-located generation — behind a single point of interconnection, so ERCOT meters only the site’s net exposure with the grid rather than each individual resource. Building on that base, Batch Zero introduced two new constructs:
Withdrawal-Limited Private Use Network (WLPUN): a load that brings its own new generation can connect more megawatts than transmission alone could support, in exchange for an enforced cap on grid withdrawal — for example, 1,000 MW of load that never pulls more than 100 MW from the grid, leaning on its on-site generation for the rest and exporting any surplus through SCED. ERCOT is explicit that this is not a faster interconnection; it is a way to energize more of the desired load sooner within existing transmission limits.
Provisional Controllable Load Resource (PCLR): a dispatchable, flexible load that needs no on-site generation. It connects at its full requested size, but ERCOT can dispatch it down in real time during transmission constraints (for instance, a 150 MW load backing down to 100 MW), with the cap relaxing toward a defined exit date as transmission is built out. That makes PCLR the explicit bridge-to-firm path.
Let’s now turn our attention to winners and losers. We’ll discuss turbine manufacturers like GEV, fuel cell and RICE vendors like Bloom and INNIO, IPPs like NRG. We first called out Bloom in December 2024 for Core Research subscribers as the biggest beneficiary.