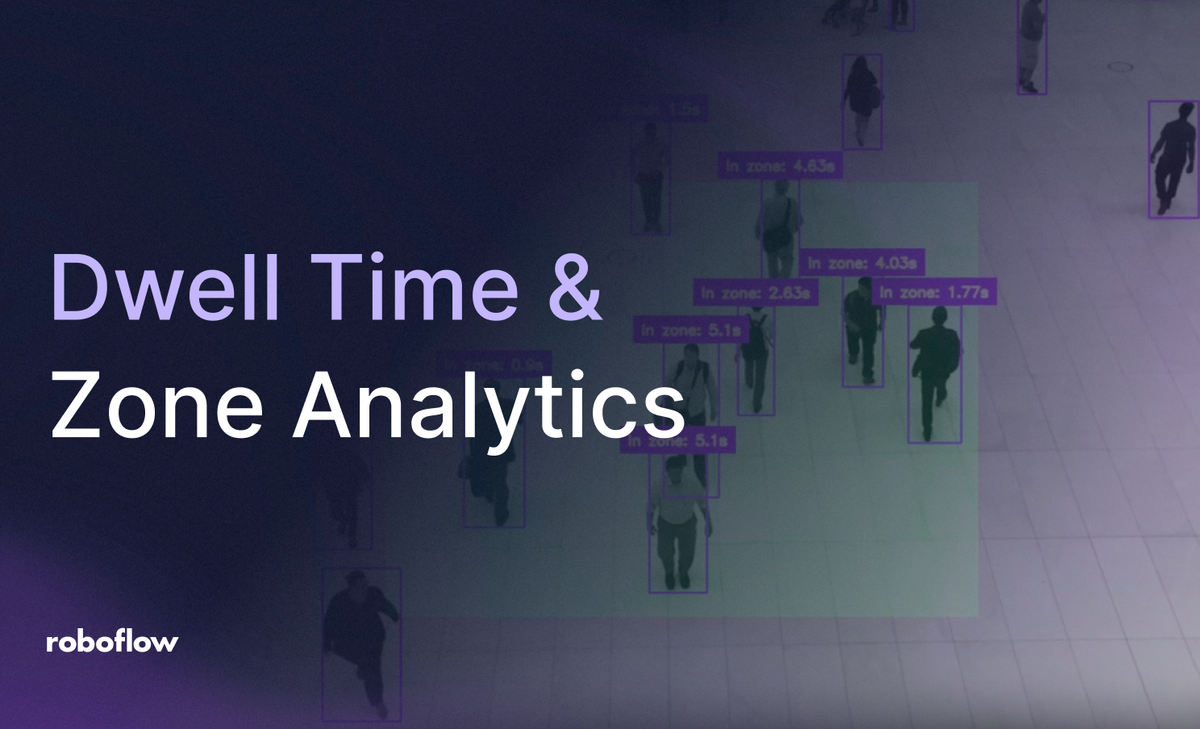
Dwell time and zone analytics measure how long each person stays inside a defined area, a stronger signal than foot traffic alone. This tutorial builds the full pipeline in Roboflow Workflows: RF-DETR detects people, ByteTrack gives each one a persistent ID, and a zone timer returns per-person dwell time plus a live unique-visitor count.
What Is Dwell Time and Zone Analytics? #
Dwell time is how long a person remains inside a defined zone, measured from the frame they enter to the frame they leave. Zone analytics is the layer built on top of it: counts, durations, and occupancy for specific areas of a camera's view, turned into decisions like restocking a display, opening a checkout lane, or flagging a blocked exit.
The distinction from related metrics matters because each one answers a different question. Foot traffic counts how many people passed through the camera's view. People counting counts unique visitors, so the same person crossing the frame twice counts once. Dwell time measures engagement: whether someone stopped, and for how long. A display that a thousand people walk past is performing worse than one where a hundred people stop for thirty seconds, and only dwell time can tell you that.
The system in this tutorial produces all three from one camera feed. The detection model finds people, the tracker gives each one a persistent ID for unique counting, and the zone timer measures how long each ID stays inside the polygon you define.
In this tutorial, you will train an RF-DETR model in Roboflow, add
for persistent object tracking, and build a
Roboflow Workflow### Dataset
Go to Roboflow Universe and search for the
__Dwell Time Analysis dataset__The dataset contains 5,917 pedestrian images collected for dwell time and zone-based analytics. It includes people walking, standing, and lingering in different environments, making it well suited for measuring how long people remain inside defined zones.
Fork the dataset into your own workspace, including all annotations, to create a separate copy that you can modify and use for training.
Train RF-DETR
Select Roboflow RF-DETR (Small) as the architecture under Custom Training. It's recommended for strong COCO benchmark performance while staying fast to train and run.
The training summary confirms the setup: 5,917 images were split into 4,142 training, 1,183 validation, and 592 test images. The model was trained at 512×512 resolution for up to 100 epochs with early stopping enabled.
Roboflow monitors mAP and key loss metrics throughout training to evaluate model performance and convergence.
With training complete, the model is ready to be integrated into the Workflow for inference and tracking.
Build the Workflow
Here's the workflow we'll build. Here's what each block does in this workflow:
Object Detection Model: Runs the trained RF-DETR model and returns bounding boxes for each detected person.ByteTrack Tracker: Assigns persistent tracker IDs across frames.Cumulative Tracker Count: Counts unique tracker IDs seen so far.Time in Zone: Tracks how long each tracker ID stays inside the defined polygon.Bounding Box Visualization: Draws boxes around each detected person.Polygon Zone Visualization: Draws the zone outline on the frame.Label Visualization: Adds dwell time labels for people inside the zone.Text Display: Overlays the cumulative count on the frame.
Step 1: Create a new Workflow and add the Object Detection Model block
Open the Workflows tab and create a new Workflow. Roboflow automatically adds the Image Input and Outputs blocks to start the pipeline.
Add an Object Detection Model block, connect the image input, and set the model to your trained RF-DETR model. Configure IoU Threshold: 0.3, Confidence Mode: Custom, Custom Confidence: 0.5, and Max Detections: 300.
- *This block is the entry point for all detections; everything downstream reads from its predictions output.
Step 2: Add the ByteTrack Tracker block
Add a ByteTrack Tracker block, connect it to the image input and the Object Detection Model's predictions. Configure Minimum IoU Threshold: 0.4, Minimum Consecutive Frames: 2, Lost Track Buffer: 60, and Track Activation Threshold: 0.3.
This block assigns a persistent tracker ID to each detected person, which the count and dwell time blocks downstream depend on.
Step 3: Add the Cumulative Tracker Count block
Add a Custom Python Block named Cumulative Tracker Count. Connect it to the image input and the ByteTrack tracker's tracked detections. It takes image and detections as input and returns a single count output.
- *Open Edit Code to keep a running set of tracker IDs seen per video source, and return the size of that set as the cumulative count.
def run(self, image, detections):
    if not hasattr(self, 'seen_tracker_ids_by_video'):
        self.seen_tracker_ids_by_video = {}
    video_key = 'default'
    try:
        video_metadata = getattr(image, 'video_metadata', None)
        if isinstance(video_metadata, dict):
            video_key = str(
                video_metadata.get('video_identifier')
                or video_metadata.get('source_id')
                or video_metadata.get('run_id')
                or 'default'
            )
        elif video_metadata is not None:
            video_key = str(
                getattr(video_metadata, 'video_identifier', None)
                or getattr(video_metadata, 'source_id', None)
                or getattr(video_metadata, 'run_id', None)
                or 'default'
            )
    except Exception:
        video_key = 'default'
    seen = self.seen_tracker_ids_by_video.setdefault(video_key, set())
    tracker_ids = getattr(detections, 'tracker_id', None)
    if tracker_ids is not None:
        for tracker_id in tracker_ids:
            if tracker_id is None:
                continue
            try:
                tracker_id_int = int(tracker_id)
            except Exception:
                continue
            if tracker_id_int >= 0:
                seen.add(tracker_id_int)
    return {'count': int(len(seen))}
Keying the tracker set by video_key keeps counts isolated per video source, so running the workflow on multiple streams doesn't mix their totals together.
- *This block produces the running total that feeds into the Text Display block later in the pipeline.
Step 4: Add the Time in Zone block
Add a Time in Zone block, connect it to the image input and the ByteTrack tracker's tracked detections. Set Triggering Anchor: BOTTOM_CENTER, and define the Polygon Zone coordinates for the area you want to track.
- *Enable Remove Out of Zone Detections and Reset Out of Zone Detections so a person's dwell timer clears once they leave the zone, rather than continuing to accumulate. It outputs timed_detections, which the visualization blocks use downstream.
Step 5: Add the Bounding Box Visualization block
Add a Bounding Box Visualization block, connect the image input and the ByteTrack tracker's tracked detections. Keep Copy Image enabled so the original frame isn't modified in place, and leave the Default color palette.
This draws a box around every detected person, regardless of zone status, and feeds into the Polygon Zone Visualization block next.
Step 6: Add the Polygon Zone Visualization block
Add a Polygon Zone Visualization block, connect it to the Bounding Box Visualization output image. Use the same Polygon Zone coordinates as the Time in Zone block, set Color: #00FF00, and Opacity: 0.18.
- *This overlays the zone boundary on top of the bounding boxes, using a light green fill so the zone is visible without hiding the people inside it.
Step 7: Add the Label Visualization block
Add a Label Visualization block named dwell_time_label_visualization, connect it to the Polygon Zone Visualization output image and the Time in Zone block's timed_detections. Set Text: Time In Zone.
- *This draws dwell time labels only for people inside the defined zone by using timed_detections instead of the full set of detections.
Step 8: Add the Text Display block
Add a Text Display block named count_overlay, connect it to the Label Visualization output image. Set Text: "People Detected: {{ $parameters.count }}", with Text Parameters mapped to $steps.cumulative_tracker_count.count. Set Text Color: WHITE, Background Color: BLACK, Background Opacity: 0.7.
- *This combines the cumulative count from Step 3 with the annotated image from Step 7 into a single output frame.
Step 9: Configure the Outputs block
Configure the Outputs block with output_image from the Text Display block, raw_predictions from the Object Detection Model, count from Cumulative Tracker Count, tracked_detections from ByteTrack, and timed_detections from Time in Zone.
With everything connected, the full Workflow looks like this.
- *The Workflow takes an image or video frame as input and returns an annotated frame with person detections, the defined zone, per-person dwell time, and a live cumulative visitor count.
Results #
The Workflow correctly separates zone occupancy from overall foot traffic. Although 33 people are detected in the frame, only those inside the defined zone receive a dwell time label, with each timer reflecting how long that individual has remained in the area.
- *People outside the zone are still detected and tracked, but no dwell time is assigned to them. This confirms that the Time in Zone block only measures detections inside the defined polygon.
The example uses People Walking, one of Roboflow Supervision's built-in video assets.
Production Deployment #
To move beyond a single video, connect Roboflow Inference to a live RTSP stream or webcam. The same Workflow processes incoming frames without requiring any changes.
Scaling to multiple cameras is just as straightforward. Run the same Workflow for each stream and configure zone coordinates to match each camera's viewpoint.
For production deployments, log the count and timed_detections outputs instead of relying on the preview. This creates a historical record of occupancy and dwell time, making it easier to identify trends such as peak traffic and congested areas.
The model should also be updated over time. Review low-confidence detections from live footage, add them back to the dataset, and retrain periodically to improve performance on your deployment environment.
Use Roboflow Agent for People Counting #
Roboflow Agent can assemble this Workflow from a prompt instead of block-by-block wiring. Describe the pipeline in plain language ("detect people with my trained model, track them with ByteTrack, keep a running count of unique visitors, time how long anyone stays inside this polygon, and draw the zone, boxes, and dwell labels on the frame") and Agent generates the connected blocks for you to review in the editor.
It's just as useful after the build: ask it to move the zone, raise the confidence threshold, or add a second polygon for another display, and it edits the Workflow in place.
Where Dwell Time and Zone Analytics Get Used #
Retail is the anchor use case. Dwell time at a display measures whether a promotion stops shoppers, and comparing zones tells you which end cap earns its floor space. Store layout decisions that used to rely on intuition get a number.
Queue monitoring uses the same pipeline with the zone drawn over the waiting area. When average dwell time in the queue zone crosses a threshold, that's the signal to open another register or reroute staff before customers start walking out.
Occupancy monitoring flips the metric from individuals to the zone itself: how many people are inside an area right now, and how long it has been crowded. Facilities teams use it for room utilization, and safety teams use it for capacity limits in spaces where crowding is a safety hazard.
Restricted area alerting is the security variant. Any dwell time above zero in the wrong zone is the event: a person lingering by a dock after hours, or anyone at all inside a machine's safety perimeter. The Workflow you'll build handles all four cases; only the zone coordinates and the alert logic change.
People Counting Conclusion #
This Workflow processes a video feed with RF-DETR and
__ByteTrack__The Workflow is easy to reuse because only the detection model and zone coordinates need to change. The same pipeline can be adapted for queue monitoring, room occupancy, restricted area alerts, and other zone-based analytics.
Further Reading
Cite this Post
Use the following entry to cite this post in your research:
Mostafa Ibrahim. (Aug 4, 2026). Dwell Time and Zone Analytics with Vision AI. Roboflow Blog: https://blog.roboflow.com/dwell-time-and-zone-analytics/