· 4 min read
I wanted to see what the vectors behind my website’s search actually looked like. On 6 November 2026, I took a snapshot of its published index: 85 pages, split into 1,128 text chunks, each represented by a 512-dimensional embedding. Plotting them gave me a way to choose which passages to inspect.
Retrieval-augmented generation (RAG) retrieves document passages before passing them to a language model. An embedding represents text as numbers used for similarity search. This exercise looks at that retrieval data, using my website as a small, inspectable example. It complements the broader checks in Validating a vector database built for RAG.
In brief #
- A projection map helps me find groups and isolated passages to inspect, but moving 512 dimensions into two changes their relationships.
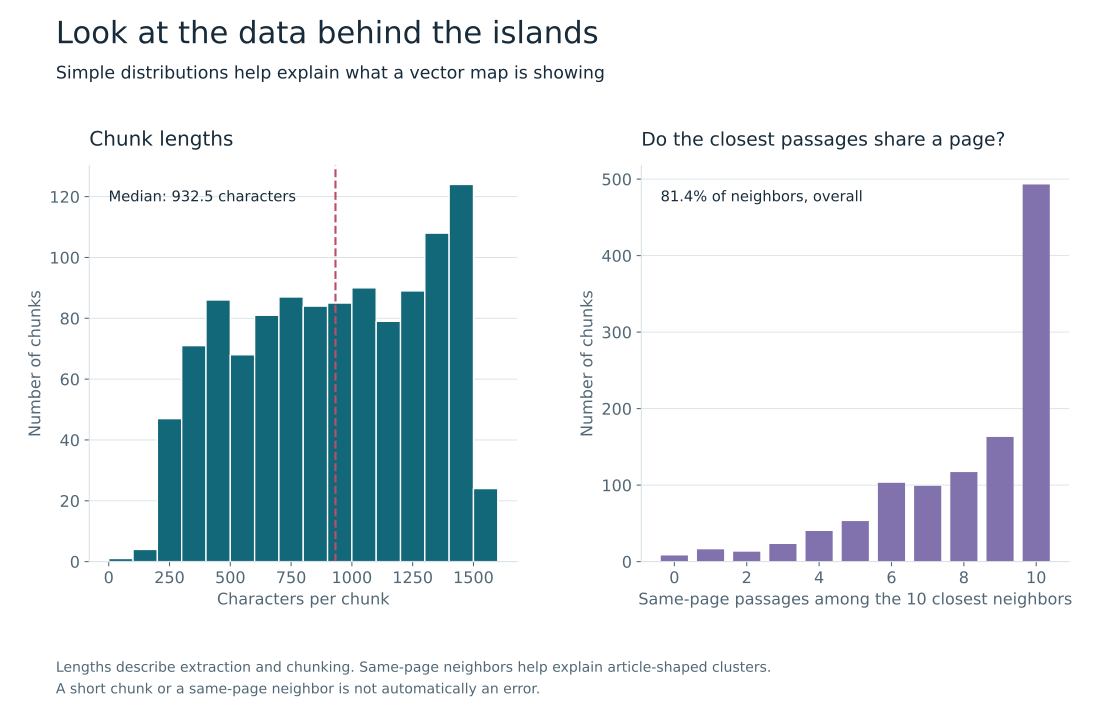
- Exact neighbors and source text help explain what a visible group represents. In this index, 81.4% of the ten closest neighbors come from the same page.
- Visual inspection can reveal repeated content and broken chunk boundaries. Questions with reviewed answers are still needed to measure retrieval quality.
Use a map to choose what to inspect #
Different projections emphasize different relationships, so I compare views before interpreting a cluster. Principal component analysis (PCA) gives a linear baseline. t-distributed stochastic neighbor embedding (t-SNE) emphasizes local neighborhoods. Uniform Manifold Approximation and Projection (UMAP) builds its view from a neighborhood graph.
For each map, I compared every point’s ten closest neighbors with its ten closest vectors in the original space. The displayed PCA, t-SNE and UMAP settings retained 13.1%, 75.1% and 64.5% respectively. These percentages measure the map’s fidelity, not search accuracy. They describe these settings on this corpus, rather than a general ranking of the methods. Open the scalable map or compare four projections of the same data.
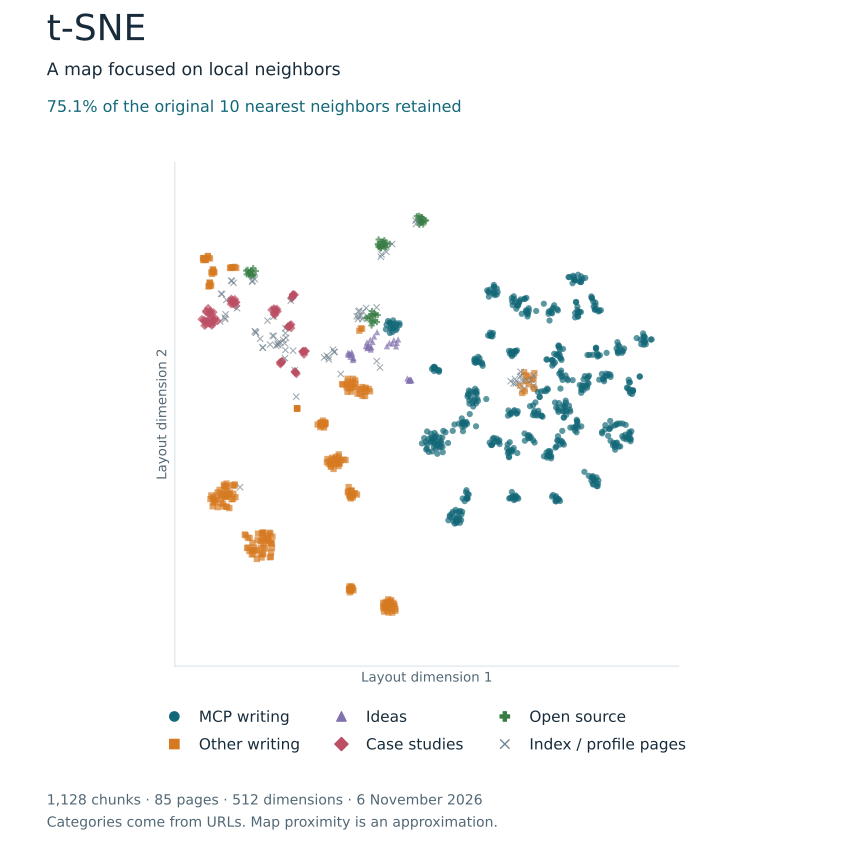
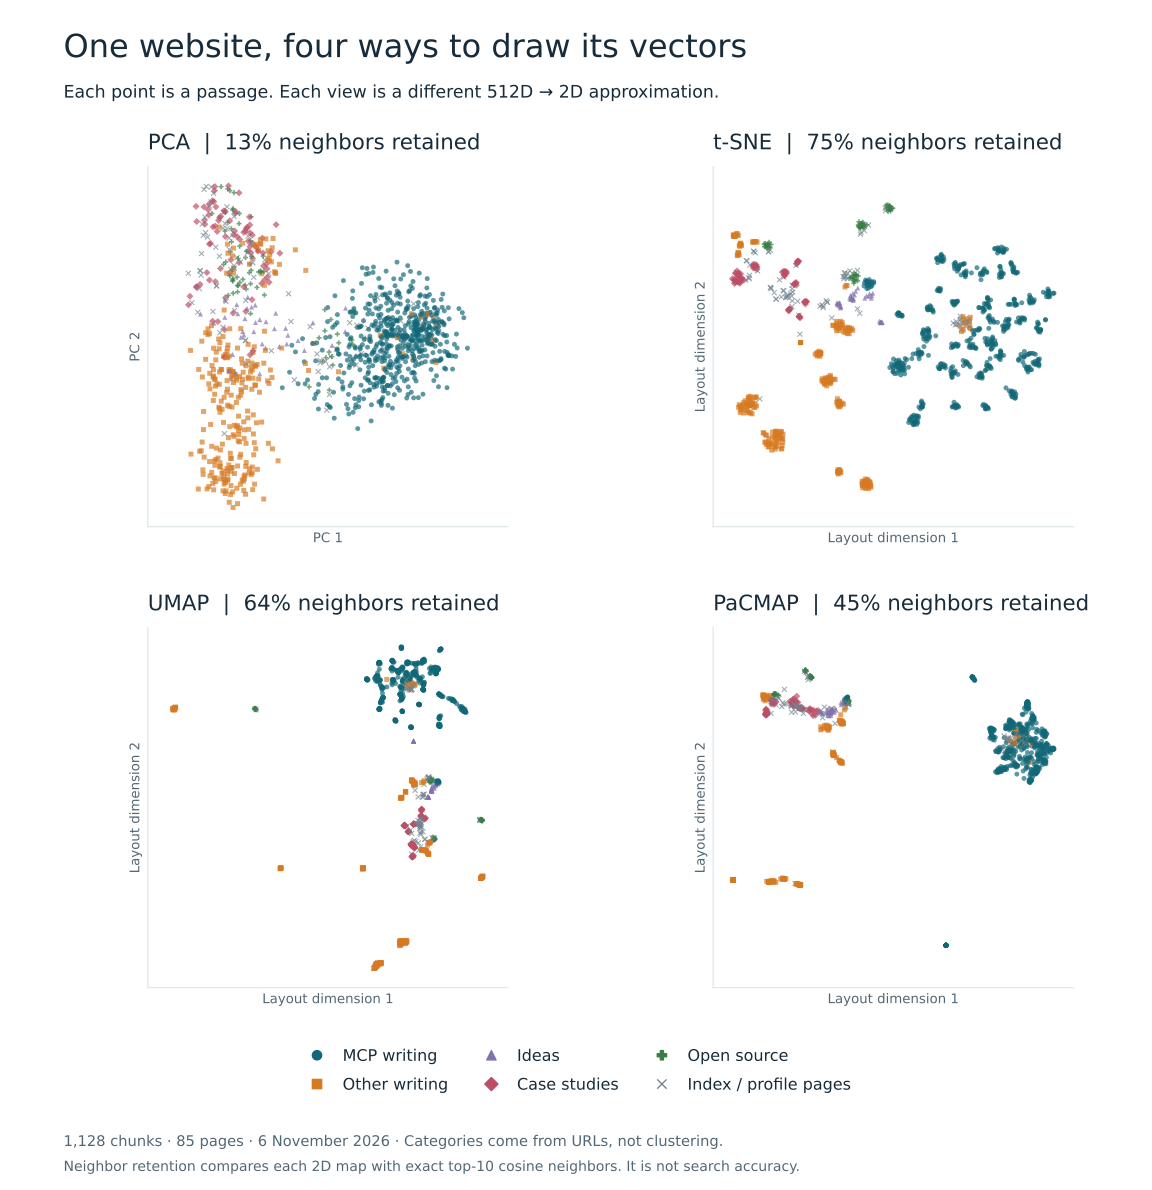
The islands give me places to investigate. Their spacing and apparent size are not reliable semantic measurements, as How to Use t-SNE Effectively illustrates. An isolated point might be a distinctive passage, an index page or an extraction problem. I need its text to tell those apart.
Check the neighbors in the original space #
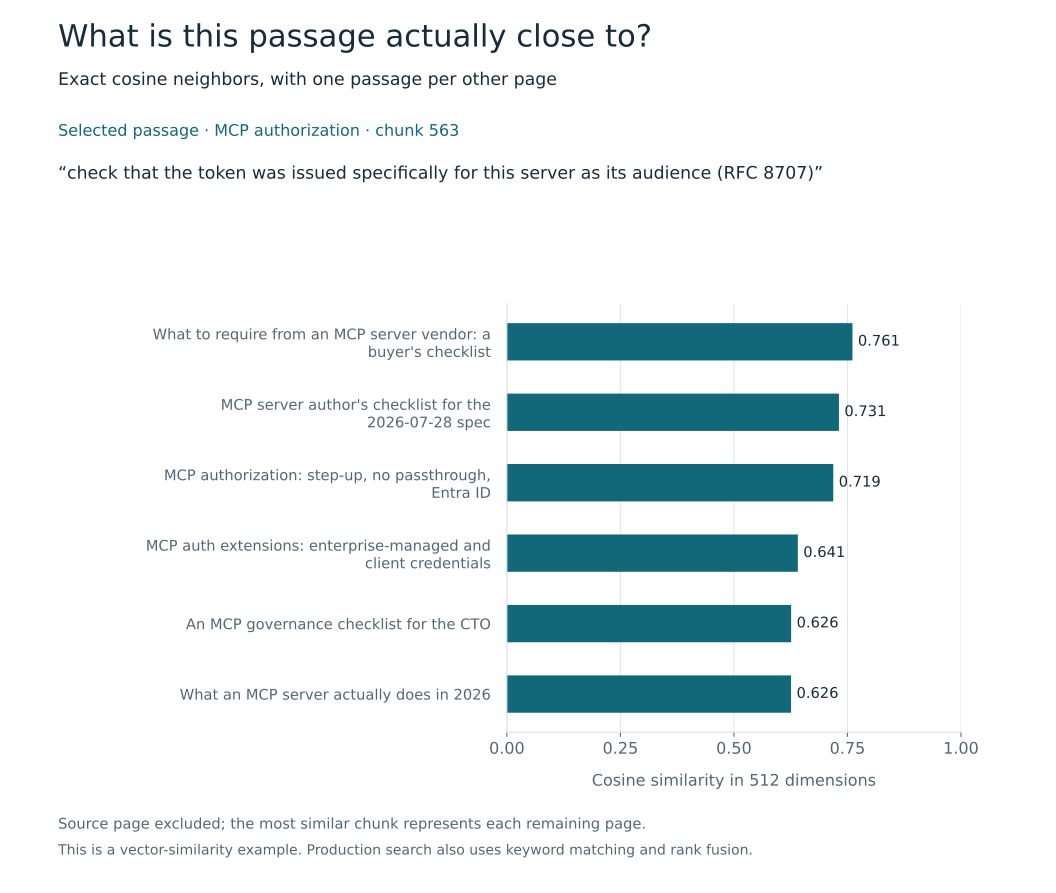
I confirm a map’s suggestion by looking up exact cosine neighbors in all 512 dimensions. For one passage about checking an access token’s audience, I excluded its own page and kept the closest chunk from each other page. That makes the comparison more useful than repeatedly returning the same article.
Open the scalable neighbor comparison. The strongest cross-page pair elsewhere in the index had cosine similarity 0.944. Reading it showed repeated article listings on the Writing index and the MCP series page. The similarity was understandable; it was not evidence of two independently written passages reaching the same conclusion. This is why I inspect the text before treating a group as a topic or a pair as unwanted duplication.
Look at the chunks behind the picture #
Simple distributions help explain why the map takes its shape. Longer articles contribute more points, and passages from one page often share a subject. The embedding input also includes the page title and heading path.
Open the scalable diagnostics.
This snapshot has five chunks below 200 characters and 24 at the 1,500-character cap. Inspecting adjacent chunks on the FluentCMS page found a URL split after https://docs.strapi.io/cms/fea, with tures/admin-tokens) beginning the next chunk. That is a concrete boundary defect. Its effect on retrieval still needs testing.
Method and caveats #
The snapshot was built at 4:49 p.m. Toronto time on 6 November 2026, using openai/text-embedding-3-small at 512 dimensions. I normalized each vector to unit length, kept the metadata aligned with its row and checked that all 85 sitemap pages were present. There were no empty chunks, zero or non-finite vectors, or exact duplicate chunk bodies.
The t-SNE example uses cosine distance, perplexity 30 and seed 42; UMAP uses cosine distance, 30 neighbors, minimum distance 0.1 and the same seed. I also tried other settings. The figure pack and method notes include all eight projection examples, a similarity heatmap, a hierarchy, the diagnostics and recorded parameters. The plots were calculated from existing vectors; no new embeddings were generated for this analysis.
This is an inspection of a website retrieval index, not an evaluation of a complete RAG answering system. The site combines vector and keyword results. Before claiming retrieval quality, I would test representative questions against reviewed answer-bearing passages and compare the actual ranked results. The visual checks tell me where to look and what to test next.