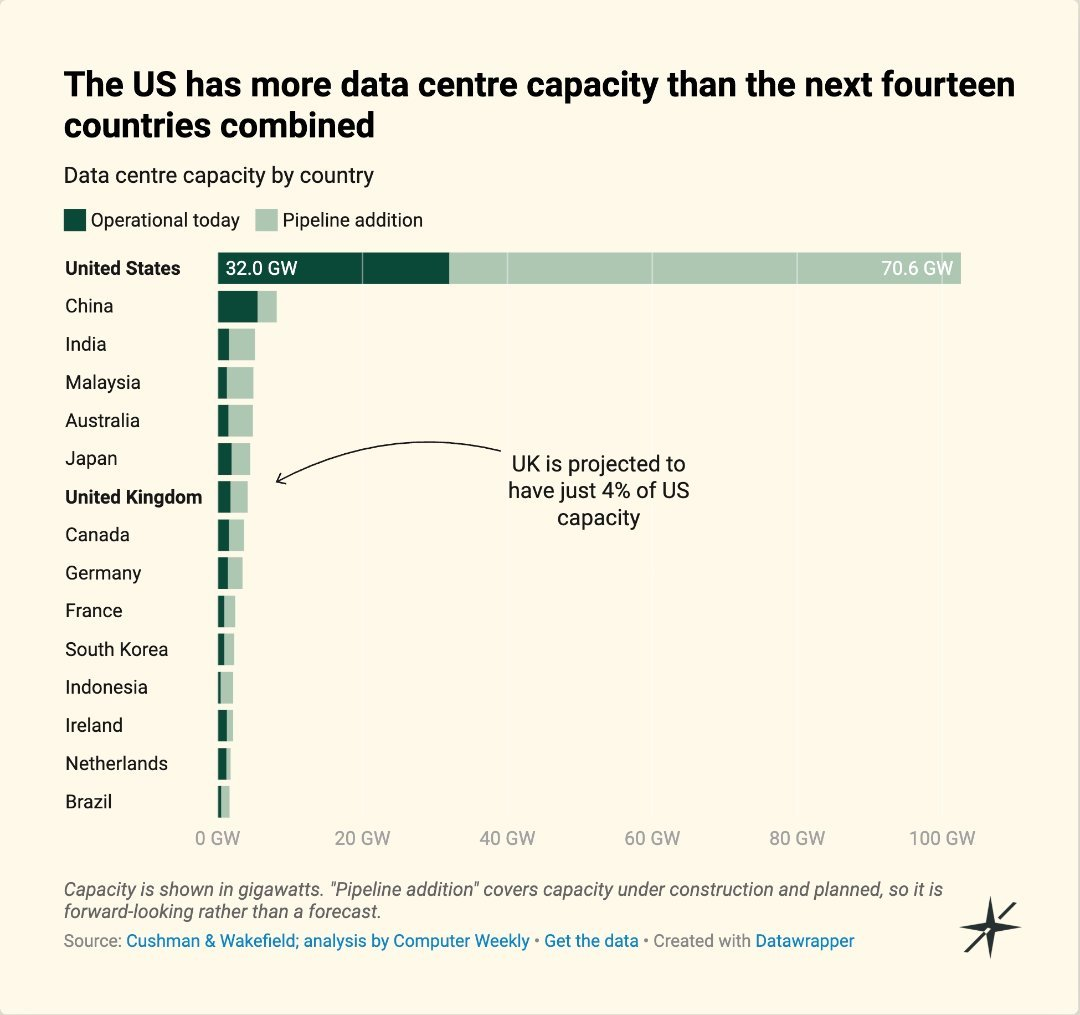
The United States is not just ahead in the global race to build AI infrastructure; it is operating in a different league altogether. New data shows that the US has more datacenter capacity, counting both what is running today and what is in the pipeline, than the next 14 countries put together.
The figures, from real estate firm Cushman & Wakefield and analysed by Computer Weekly, were highlighted in a British Progress report on Britain’s AI strategy. They rank 15 countries by datacenter capacity in gigawatts (GW), split into capacity that is operational today and “pipeline additions”, which covers capacity that is under construction or planned.
The US is in a league of its own #
The US currently has about 32 GW of operational datacenter capacity, with another 70.6 GW in the pipeline. That takes its total to roughly 102.6 GW.
Add up the other 14 countries on the list, from China at the top to Brazil at the bottom, and the total comes to about 50.9 GW. The US, in other words, is on track to have about twice as much capacity as all of them combined.
The gap is even starker in the pipeline. The US has 70.6 GW of new capacity under construction or planned, compared to about 29.2 GW for the other 14 countries taken together, or more than 2.4 times as much. On capacity that is operational today, the US leads by a smaller but still large margin: 32 GW versus about 21.7 GW for the rest of the list.
This lines up with a broader shift in the American economy. Spending on datacenter construction in the US has overtaken office construction for the first time, and datacenter building has accelerated sharply since the launch of ChatGPT in November 2022.
China and India take 2nd and 3rd place #
Once the US is set aside, the rankings look very different.
China is second, with a total of about 8.2 GW. It has 5.5 GW operational today, which is the most of any country outside the US, but only 2.7 GW in the pipeline. That means China’s total is just about 8% of the US figure, and it is one of only three countries on the list, along with Ireland and the Netherlands, expected to add less capacity than it already has.
India comes in third with about 5.1 GW, made up of 1.6 GW operational and 3.5 GW in the pipeline. Its pipeline is more than twice the size of its current capacity, reflecting the wave of billion-dollar commitments from Microsoft, Amazon and Google to build AI infrastructure in the country.
The gap between India and the countries just behind it is small. Malaysia (4.9 GW), Australia (4.8 GW) and Japan (4.5 GW) are all within touching distance. Malaysia’s pipeline of 3.6 GW is actually the largest of any country outside the US, slightly ahead of India’s 3.5 GW.
The UK sits sixth, with 1.8 GW operational and 2.4 GW in the pipeline, for a total of about 4.1 GW. That works out to roughly 4% of the US total, which is the figure the British Progress report uses to underline how far Britain trails the American buildout.
Canada (3.6 GW), Germany (3.4 GW), France (2.4 GW), South Korea (2.3 GW), Indonesia (2.1 GW), Ireland (2.1 GW), the Netherlands (1.7 GW) and Brazil (1.6 GW) round out the list.
Why this matters #
Datacenter capacity is increasingly the physical foundation of AI: it determines how much compute a country can host for training and running models, and how much of the economic value from AI is likely to be captured locally.
China, for its part, is looking beyond the ground in its own bid to expand compute, with reports that it plans gigawatt-scale space-based datacenter infrastructure by 2030 as part of its Five-Year Plan.
One caveat: the chart’s pipeline numbers cover capacity that is under construction and planned, so they are forward-looking rather than a forecast. Not everything in a pipeline gets built, and the US figure in particular will depend on the availability of power, equipment and financing. But even if only a fraction of the American pipeline is delivered, the US would still lead the rest of the list by a wide margin.
The full data #
| Country | Operational today (GW) | Pipeline addition (GW) | Total (GW) |
|---|---|---|---|
| United States | 31.97 | 70.63 | 102.60 | | China | 5.49 | 2.66 | 8.15 | | India | 1.58 | 3.53 | 5.11 | | Malaysia | 1.29 | 3.59 | 4.88 | | Australia | 1.49 | 3.33 | 4.82 | | Japan | 1.94 | 2.52 | 4.46 | | United Kingdom | 1.76 | 2.36 | 4.12 | | Canada | 1.55 | 2.06 | 3.61 | | Germany | 1.40 | 2.04 | 3.44 | | France | 0.92 | 1.50 | 2.42 | | South Korea | 0.94 | 1.31 | 2.25 | | Indonesia | 0.39 | 1.75 | 2.14 | | Ireland | 1.27 | 0.82 | 2.09 | | Netherlands | 1.18 | 0.57 | 1.75 | | Brazil | 0.51 | 1.12 | 1.63 |
Source: Cushman & Wakefield; analysis by Computer Weekly, via British Progress. Totals calculated by adding operational and pipeline capacity.