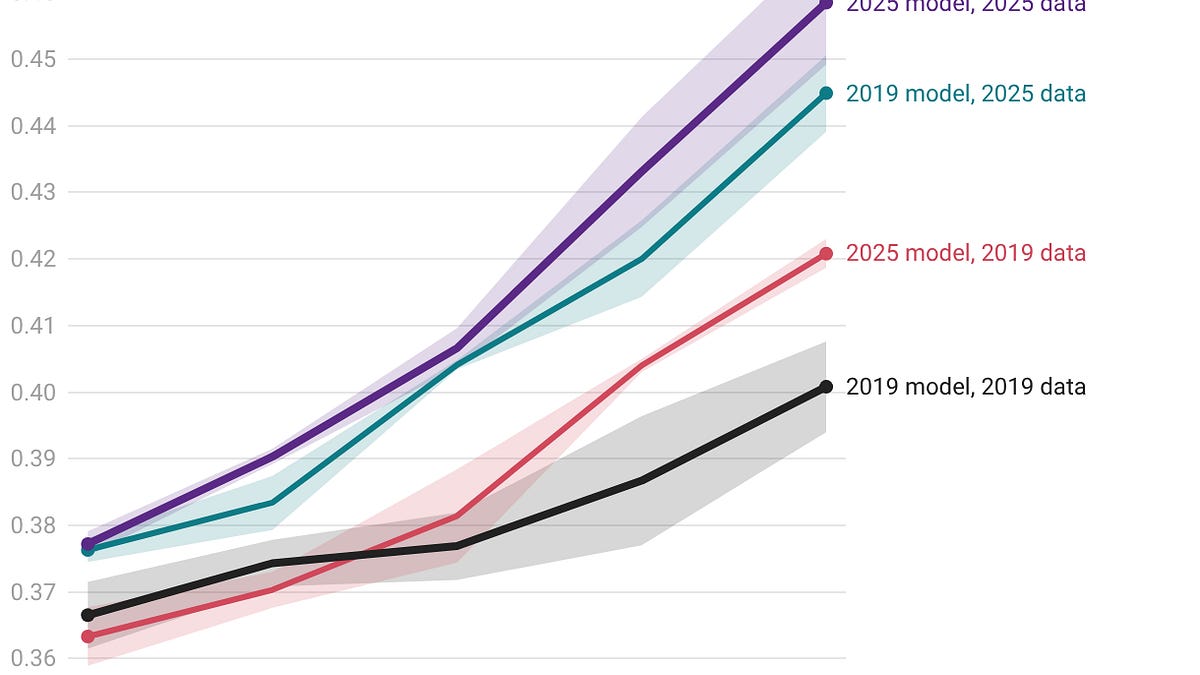
How much of the rapid progress in AI that we’ve seen over the last few years1 has come from data versus model improvements? The answer has big implications for the economics of frontier labs and the pace of future progress.
We investigate this question at a relatively small scale, and for pretraining specifically, from 2019 to 2025. During each of those years, a new open model recipe was published which codified that year’s publicly known algorithmic tweaks (for example, improvements in architecture, optimizer, initializations, learning rate schedule, hyperparams, etc). And during each of those years, there was also a new public data corpus (produced by broader scrapes and new curation/extraction/filtering techniques).
We train combinations of these year-representative model recipes and data corpuses across different scales of training compute (up to 1e19 FLOPs)2.
Obviously, we can’t compare these different models by their cross-entropy loss against a fixed dataset, since we’re varying the datasets they’re trained on. So instead we evaluate these models on end capabilities as measured by the OLMES eval (which aggregates 10 different relatively easy benchmarks, mostly multiple choice QA). Unfortunately, evaluating end capability rather than pretraining loss adds some noise to our results, as you’ll see in the graphs below, though we try to get cleaner bounds by running multiple seeds.
We find that from 2019 to 2025, 3.24x more compute efficiency gains have come from data improvements rather than model improvements (12.0x for data and 3.7x for models), at the 1e19 FLOPs compute budget3.
Here is a grid which shows how much better a model we train does on the end capability we're testing it on, relative to the 2019 data + architecture baseline, at 3.16e18 FLOPs4.
We find that the gains from data and model improvements are mostly independent and don’t interact (i.e. realizing the gains from some model improvement doesn’t require a specific training datapile, or vice versa). 88% of the variance in the OLMES score can be explained by additive effects of the model and data improvements (using a linear model).
Discussion #
For context, let’s briefly summarize what changed on both the data and the model side from 2019 to 2025. On the model side, we went from GPT-2 to OLMo-2, including key innovations in optimizers, positional encodings, normalization, activation functions, initializations, and more5.
On the data side, we started with OpenWebText in 2019, which contained just web pages linked from Reddit with enough upvotes and then deduplicated and filtered, and thus amounted to only ~9B tokens (this was mostly what GPT-2 was trained on). By 2025, open source data corpuses like UltraFineWeb not only are far larger (by using scrapes of the whole Internet), but also use much more sophisticated filtering (for example, by training a classifier to predict what data will empirically improve model performance).
A naive interpretation of our result is that most of the AI progress from 2019-2024 (the era of pretraining) was just better data engineering (extraction, curation, etc.), and that all the model work during that period was much less important.
But this is probably the wrong way to think about the value of model improvements. Their main contribution was not necessarily compute efficiency - that is, achieving the same performance with fewer FLOPs. Rather, it was making larger amounts of compute usable in the first place. As the number of parameters, context lengths, run duration, and clusters scale up, all kinds of things are prone to breaking (gradients explode or vanish, memory and bandwidth run out, training becomes infeasibly slow). Much of model research has consisted of removing or pushing back these constraints to scaling. Many of the most important innovations such as MoEs, sparse attention variants, stability innovations (norm placements, initializations, etc.) and system / kernel-level optimizations like FlashAttention fall into this category.
The data improvements we investigated here might matter less for larger models. Small models (like the ones we trained) see significant gains from data quality improvements, because they don’t have that much capacity, and so you have to be really careful about what you stuff into them. Whereas big models have so much excess capacity that maybe you just want to throw in as much stuff as you can, even if it’s mostly garbage, and the magic of stochastic gradient descent will separate out the signal from the noise. If you choose to filter aggressively, you’ll have to do dozens of epochs, which empirically gives worse performance than just having a lower average quality but larger dataset. In fact, aggressive data curation is even more harmful once you take into account that frontier models are up to 100x overtrained relative to Chinchilla optimal, in order to minimize the inference compute used for RL and for deployment.
An analogy might be the difference between a sailboat and a container ship - the container ship doesn’t necessarily go faster, but it can lug thousands of tons of cargo (analogous to hundreds of trillions of tokens of pretraining data), and won’t be toppled by choppy waters (analogous to training stably across hundreds of thousands of GPUs).
Now that we have more capacious and sturdy container ships, we don’t have to fret about exactly what we load on board - we can just fill them up with everything that’s even remotely and plausibly useful. Whereas for the tiny flimsy sailboats of 2019, you’d have to be incredibly careful about only carrying the most valuable cargo.
But to the extent that the nature of pretraining progress is simply more cargo into this ship, are we running out of cargo? This is a question about the data wall and about how well synthetic data has helped us leap over it. Synthetic data is obviously being widely used at the labs, and we have not at all investigated whether it can effectively expand a data corpus without hurting model performance. If the gains are limited, then the main driver of pretraining progress will stall, because we’re not generating more internet, and you can only curate a fixed set of data by so much. To be clear, we have no active reason to think this. But given how important data seems to be in driving pretraining progress, this seems like a crucial question to investigate.
Ryan Greenblatt noted that many of the historical improvements in pretraining data corpuses look like the kind of progress that automated researchers would be able to just test empirically - for example, run ablations trained on different data and see how the model performs. So it’s totally compatible with our results that the data progress which has propelled pretraining since 2019 might speed up a lot if and when we automate AI R&D.
We want to clarify that whether pretraining progress in isolation will speed up or slow down is not really the most important question for overall AI progress, because so many of the gains over the last two years have come from RL.
Future research
These are some directions of future research that we think would be really cool, and important questions to answer:
- You could run this experiment at larger scales to see whether the data or model improvements are more dependent on scale (and thus far more impactful at the frontier)
- What is the marginal value of novel high-quality data for both pre and post-training, as measured by end capabilities?
- We want to know broadly how effectively synthetic data works. One concrete question to investigate is this: if you’ve got a small corpus of high quality data, how much better is it to magnify it via synthetic data generation relative to just training on it for multiple epochs ?
- You could figure out the implied value of data through lab spending on data brokers, environment producers, etc., relative to their spending on compute and researchers.
We wanted to investigate what role data has played in driving AI progress. There are lots of other ways one could probe this question, and some may be more clever and informative than ours. And even our experiment was done at an extremely small scale. We definitely think it’s plausible that there is something we missed - we’re eager to hear how others would research this question, and ideally to also see their results!
Thanks especially to Charlie O’Neill for many helpful discussions.
Appendix: Methodology #
We pre-train these model recipes from scratch on these different data corpuses, at varying compute budgets, with multiple independent seeds6. Our compute budgets are: 1e17, 3.16e17, 1e18, 3.16e18 and 1e19 FLOPs. The compute accounting convention is to use nominal compute C = 6ND (N = number of non-embedding parameters, D = tokens of data).
At each compute budget, we vary the number of parameters (and hence number of tokens trained on), to determine the compute-optimal mix for each training recipe x corpus combination. We use held-out loss on the corpus to determine this compute-optimal point. We can then obtain compute scaling curves of downstream performance of each combination, from which we can finally extract our compute multipliers.
We enforce a shared tokenizer and context length across every run: GPT-2 BPE (tiktoken, 50,257 vocab) and T=2048, batch = 262,144 tokens.
The end capabilities of our training runs are highly dependent on hyperparameters. Obviously, there is no way to sweep over all possible sets of hyperparams (hyperparam tuning is a fine art indeed)! We try to control for this as much as possible, and we consider peak learning rate as the main hyperparameter of significance.
Some algorithm vintages do provide specifications of what peak learning rate should be tuned to (as a function of other relevant variables such as model size, data budget, batch size, etc.). These serve as good priors for what we think the optimal learning rate is.
We first sweep learning rates at 5 anchor points - 3 different model sizes and 2 different D/N ratios. We determine the optimal learning rate of these anchor points, and fit an optimal learning rate parametric form
For all the model recipes except OLMo-2, we fit a common exponent a and b, and a model-specific lr₀. For OLMo-2, we use the prescribed optimal learning rate according to the model recipe. The reason we do this for OLMo-2 is that Ai2 published small-model ladders as part of the recipe which specified optimal hyperparameters at the scale we are investigating. We also verify, at the compute-optimal point for 3.16e18 FLOPs, that our production learning rates are at or near optimal. Main technical results
Explaining some anomalies in our graph
We observe generally increasing compute efficiency across time for both the model and data axes as expected. Some outliers that we observed:
- NeoX performs worse than GPT-2 at 1e19 (although it does better across the 1e17 to 3.16e18 range). This might arise from noise in the OLMES evaluation. We also note that on held-out pretraining loss on the FineWeb-Edu corpus, NeoX performs better than GPT-2.
- The Piles seems to do much worse than OpenWebText. This is not surprising since the Pile’s main improvement was data corpus diversity over filtering. It has a curated 22-source mixture including PubMed and arXiv papers, GitHub code, legal opinions, patents, and parliamentary proceedings. The amount of cross-domain transfer to OLMES (which is English web-prose MCQ) might be minimal for many of these tokens, thus resulting in lower compute efficiency. We note that by virtue of its larger size, we expect that the Pile should eventually be better than (the really small) OpenWebText at larger scales.
- It is also worth noting that the compute multipliers for NeoX and the Pile are obtained by extrapolation, which introduces further potential error.
How compute multipliers were calculated, as well as their error bars
- Every point on the compute scaling curves is computed from multiple independently seeded training runs. The error bars there are the standard deviation of the OLMES eval over those seeds.
- Consider some given reference level of performance at some compute level for our reference model or data corpus.
- We then calculate the compute multiplier by finding the left-most point of the compute scaling curve of our candidate model or corpus that first attains that reference level of performance. The ratio of the compute required by the reference to the compute required by our candidate is the candidate’s compute multiplier
- The error bars on the compute multipliers are obtained from a parametric bootstrap of the entire estimation pipeline, and are 1 standard deviation intervals
- We do want to highlight that we expect the actual uncertainty in the compute multipliers of the model recipes to be higher than indicated by our error bars. This is because of additional uncertainty introduced by the limited extent of hyperparameter tuning we did, and end capabilities or held-out loss is probably quite sensitive to the exact choice of peak learning rate / batch size / etc.
It is also important to note that there are many reasons why our ablations do not necessarily capture the full scope of compute efficiency gains. Indeed, from 2019 to 2025, we observe year-over-year compute efficiency gains (CEG) of 1.24x [1.19, 1.29] on the model side and 1.51x [1.45, 1.57] on the data side. Measured jointly, we observe a 1.57x YoY CEG [1.49, 1.65]7. This is indeed much lower than Anson Ho et al.’s mean estimate of 3x YoY, for the following reasons:
- Many of the gains might be scale dependent or might be especially important at longer context, and we are operating at scales too small to realize many of the gains.
- For example, OLMo-2’s layer and QK norms, parallel attention + MLP block in NeoX
- Inference efficiency optimizations (such as LLama-3’s GQA , which is a KV cache optimization) do not show up as compute multipliers in our study. We are also not investigating tokenizer improvements.
- The compute multipliers we obtain are pretty sensitive to our choice of model recipe or data corpus for each year. We have chosen what we believe to be representative model recipes or data corpuses. But by no means do we exhaustively conclude that these are thebest of each year.
- We are looking at compute multipliers with respect to the OLMES benchmark (which combines 10 different relatively easy task types) rather than compute multipliers in getting to some perplexity metric. We would also have very different looking numbers if we were looking at other benchmarks (say, coding- or problem-solving-specific ones), which would probably reward very different methods of data engineering.
We also want to note that we have not investigated other data-side improvements, such as collecting more high-quality data from new sources, human expert generated data, synthetic data generation methods, etc. Most of the corpuses we have investigated are curations (subsets) of the same Common Crawl, rather than expanding the available set of data. This is clearly consumption of a finite stock - there is only so far we can push this lever.
Independence of gains from model recipe and data corpus
Here is the investigation that we did to determine how independent the gains from model recipe and data corpus are. We looked at the grid of OLMES scores at 3.16e18 FLOPs. A linear regression of OLMES score = mean + model effect + data effect gives an R squared of 0.88, which means 88% of the variance in the OLMES score can be explained by additive effects of the model and data improvements, with only ~12% of the variance accounted for by interaction or higher order terms, and eval noise. This hints that complex model-data interactions (where exploiting some model improvement is contingent on some specific data engineering, or vice versa) are relatively minor.
1 Anson Ho et al. estimated software efficiency improvements (in pretraining) of 3x per year (95% CI: 1.5x to 64x). As Ho mentioned in this blog, “most software progress might actually be due to data quality improvements” and “from scaling up just a small handful of scale-dependent algorithmic changes”.
2 We use the C = 6ND nominal convention for accounting for compute.
3 The 2019 model recipe was GPT-2, and 2025 model recipe was OLMo-2. The 2019 data corpus was OpenWebText, and the 2025 data corpus was UltraFineWeb.
4 Our implementation of GPT3 encountered some training instabilities (gradient spikes) on the Pile.
5 These include: Optimizer improvements, warmup + decay schedules, RoPE replacing learning absolute positions, RMSNorm + SwiGLU gated MLPs, Norm reordering, QK-norm, Z-loss regularization and cleaner inits.
[6](#footnote-anchor-6)

For the compute-scaling plots we use at least 3 seeds each. For the 7x7 grid of combinations of model recipes and data corpus at the 3.16e18 budget, we only used 1 seed each.

[7](#footnote-anchor-7)
The 1.57x YoY multiplier is computed using the joint improvement from 2019 model and corpus to 2025 model and corpus, and not the product of the 1.24x model side improvement and 1.51x data side improvement.