OpenObserve crossed 20,000 GitHub stars on July 15, but the milestone obscures what actually matters: this is the first open-source observability platform with genuine native LLM monitoring, and it costs $3 per day where Datadog charges $174. Eight thousand organizations — including Fortune 100 companies — are already running it in production. If you’re deploying AI agents and relying on Datadog, it’s worth paying attention.
Datadog’s LLM Observability Tax #
Here’s a detail Datadog buries in its documentation: LLM Observability automatically activates at $120 per day the moment it detects LLM spans in your traces. No opt-in required. No warning. Teams adding AI capabilities to their applications have reported bill increases of 40 to 200 percent that arrived without any configuration change on their part.
OpenObserve includes LLM monitoring in its base pricing — $0.30 per GB ingested, no per-host fees, no per-seat charges. The same 16-microservice application that costs $174 per day on Datadog runs on OpenObserve for roughly $3. That’s not a hand-wavy estimate; it’s a documented comparison using the OpenTelemetry Demo environment. Self-hosted is free entirely.
Why the Storage Cost Gap Is So Wide #
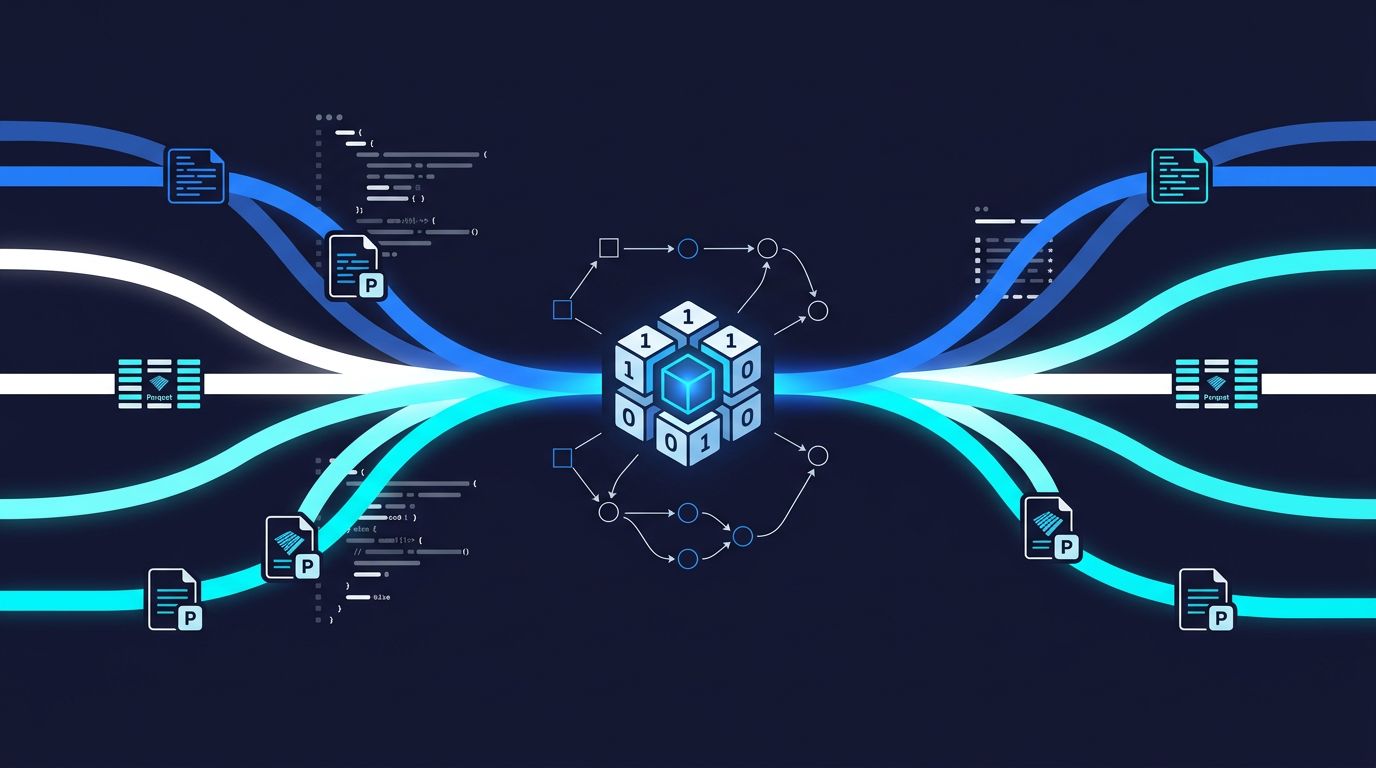
The 140x cost advantage over Elasticsearch isn’t marketing spin — it has a clear architectural reason. Elasticsearch maintains an inverted index for every field it ingests, which is efficient for full-text search but wasteful for time-series observability data. OpenObserve drops the inverted index entirely and stores telemetry as Apache Parquet files in object storage (S3, GCS, or Azure Blob).
Parquet’s columnar format compresses similar values together, achieving around 40x compression on typical log data. When Apache Arrow DataFusion runs a query, it reads only the specific columns that query needs rather than full records. Those two factors combined — no index overhead, column-only reads — explain where the cost savings come from. The GitHub repository has the full architecture breakdown if you want to verify the claims before committing.
LLM Observability That Shows You What Matters #
For developers running AI agents in production, the LLM monitoring features are the real differentiator. OpenObserve traces Claude Agent SDK pipelines end-to-end using OpenTelemetry, capturing each user turn as a root span with child spans for every model request (tokens, time-to-first-token, stop reason) and every tool call. It does the same for Amazon Bedrock agents using the OpenTelemetry gen_ai semantic conventions.
Traces are visualized as directed acyclic graphs, so you can follow exactly how a multi-step agent request flows through model calls and tool invocations. Prometheus and Grafana can tell you your CPU is high. OpenObserve can tell you which tool call in which agent chain caused the latency spike.
There’s also an MCP server integration that flips the relationship: Claude Code can query your OpenObserve instance directly, asking it to pull traces, set alerts, or investigate anomalies without leaving the terminal.
Getting Started in Under 15 Minutes #
OpenObserve deploys as a single binary or Docker container. To connect it to Claude Code, set these environment variables before starting your session:
export CLAUDE_CODE_ENABLE_TELEMETRY=1
export CLAUDE_CODE_ENHANCED_TELEMETRY_BETA=1
export OTEL_TRACES_EXPORTER=otlp
export OTEL_METRICS_EXPORTER=otlp
export OTEL_LOGS_EXPORTER=otlp
export OTEL_EXPORTER_OTLP_ENDPOINT=http://localhost:5080
Start OpenObserve with Docker, set those variables, and you’ll see agent traces appearing in the web UI at http://localhost:5080
within seconds of your first query. The full setup is in the LLM observability documentation.
The Case for Switching Now #
If your current stack is Datadog and you haven’t added AI features yet, your bill is about to change in ways you won’t enjoy. If you’re already running AI agents in production with no trace-level visibility into model calls and tool execution, you’re operating blind.
OpenObserve is past the proof-of-concept stage. A $10M Series A from Nexus Venture Partners and Dell Technologies Capital in April, Fortune 100 enterprise deployments ingesting 2.5 petabytes per day, and 20,000 GitHub stars all point to the same conclusion: this isn’t a weekend project anymore. The question is whether your observability stack can keep up with the AI workloads you’re adding to it — and whether you want to pay Datadog’s rates to find out the answer.