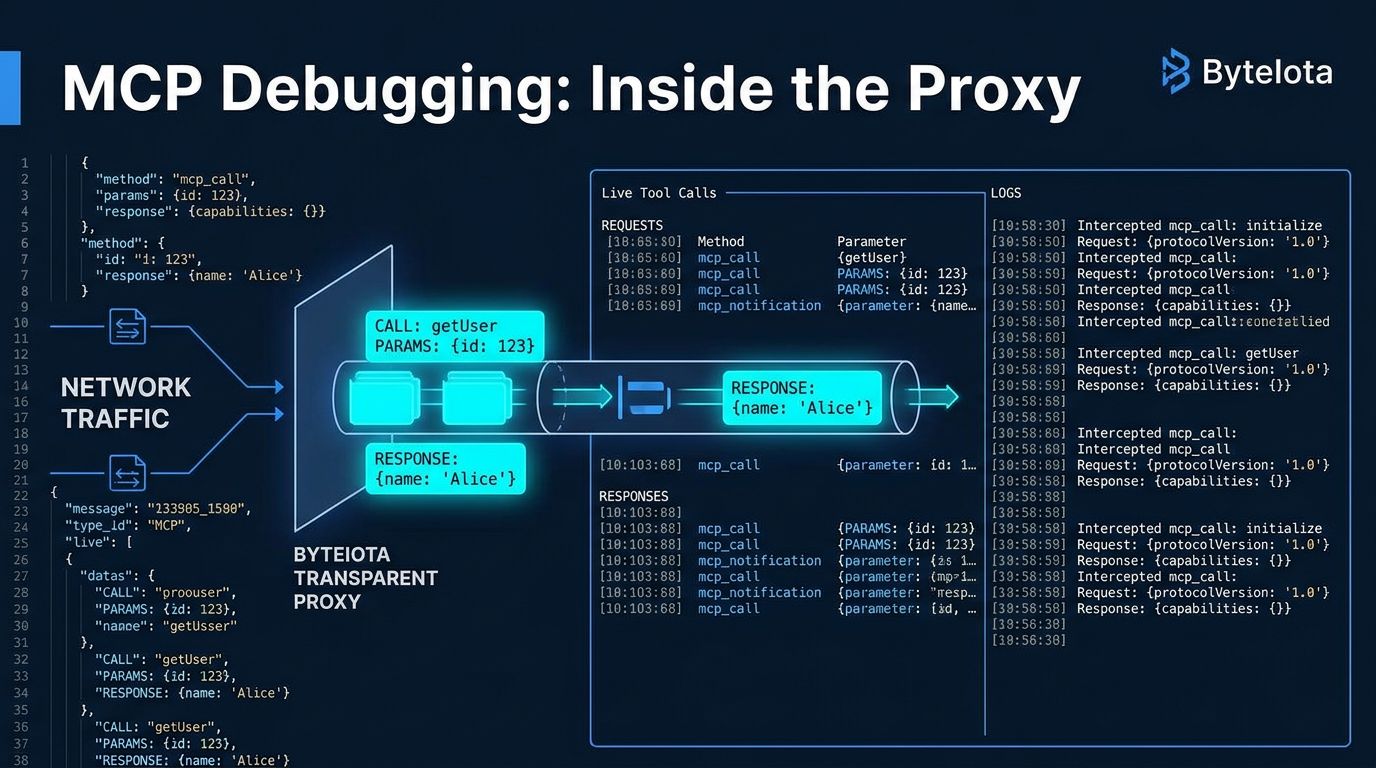
The MCP Inspector has a blind spot that nobody in the official docs mentions: it connects to your server as its own client. That means when your real agent — Claude Desktop, Cursor, your production code — silently skips a tool call or hangs with no explanation, the Inspector was watching a completely different conversation. On July 4, a developer published mcpsnoop to fix exactly that: a transparent proxy that sits directly in the stdio pipe between your AI client and your MCP server, forwarding every byte to production while shipping a live copy of every JSON-RPC frame to a terminal UI. No changes to your server code. One line in your MCP config.
Why the Inspector Misses Your Real Traffic #
The official MCP Inspector is a reasonable lab tool. You can manually trigger tools, inspect raw JSON output, and verify your server responds correctly. What it cannot do is show you what actually happens when Claude Desktop or Cursor talks to your server in a live session.
The Inspector connects as a separate, independent client. It negotiates its own capability handshake, issues its own tool calls, and sees its own responses. Your production agent’s requests never touch it. So when a tool silently fails to get called — a mismatch in capability negotiation, a schema change, a timing issue — the Inspector shows nothing, because nothing happened on its connection.
This is the same problem network engineers solved with packet capture decades ago. You don’t debug a TCP connection issue by opening a second connection to the same server and seeing if that one works. You put a probe in the actual data path. mcpsnoop does the same thing for MCP.
What mcpsnoop Actually Shows You #
mcpsnoop is a single Go binary with no runtime dependencies. It runs in two modes at once: a shim that wraps your server command and forwards all traffic verbatim, and a hub with a live terminal UI that receives a copy of every frame. Start the hub with mcpsnoop
and it opens a TUI. Add the shim to your client config and your real agent’s traffic starts flowing in.
What you see per frame:
- Every JSON-RPC request, response, and notification with full payloads
- Server stderr output (the first thing to check when a tool misbehaves)
- Per-call latency, with a live timer that makes hung calls obvious immediately
- Tool-level
result.isError
— separate from HTTP status codes, this is the flag a tool sets when it handled a request but the result is an error - The full capability handshake between client and server at session start
You can filter the live stream with query tokens: tool:search_files
to isolate one tool, status:error
to surface only failures, dir:request
to watch outbound calls. Full-text search inside individual frames works from command mode.
Setup: One Config Change #
Install the binary:
go install github.com/kerlenton/mcpsnoop/cmd/mcpsnoop@latest
Then wrap your server command in your client’s MCP config. For Claude Desktop:
{
  "mcpServers": {
    "my-server": {
      "command": "mcpsnoop",
      "args": ["--", "node", "build/index.js"]
    }
  }
}
Start mcpsnoop
in a terminal, restart your client, and your real traffic appears live. The shim and hub find each other automatically via a Unix socket — you don’t need to coordinate startup order.
If your server runs over streamable HTTP instead of stdio, mcpsnoop operates as a reverse proxy:
mcpsnoop http --target http://localhost:3000/mcp --listen :7000
Point your client at localhost:7000
instead of the server directly. Same visibility, different transport.
Replay and Export #
Observing traffic is useful. Being able to reproduce it without re-driving a full agent session is what actually speeds up debugging.
mcpsnoop lets you replay any captured tool call against a fresh, isolated copy of your server. Found the exact request that triggers the bug? Press replay, fix your server code, replay again. No need to prompt an LLM and hope it makes the same tool call.
For sharing or archiving, the export command supports JSON, HTML, and plain text. JSON exports include correlated calls, durations, status, tool-level error flags, the capability handshake, and the raw frames. In the TUI, press e
to export the selected session as HTML, or use :export json|html|text [path]
from command mode.
The Production Timing Is Right #
According to Zuplo’s 2026 MCP state report, 41% of software organizations are already running MCP servers in limited or broad production. The official MCP org’s GitHub Discussions shows mcpsnoop getting traction in the community within days of release.
MCP reached 97 million monthly SDK downloads in under 18 months — comparable to React’s scale, at roughly triple React’s growth speed. At this adoption level, you need real traffic visibility when things break in production, not a lab tool that operates on a parallel connection.
mcpsnoop is pre-1.0 (semantic versioning on the 0.x track), so minor releases may change user-facing behavior. The GitHub repo has prebuilt binaries for Linux and macOS, and the tool surfaced in the Hacker News Show HN thread just days ago with solid community engagement.
One security note: mcpsnoop runs the server command it wraps, with the same permissions. Only use it to wrap servers you already trust. For untrusted servers, run them in a container.