← All postsEngineering Running an LLM on Kubernetes is rarely just a Deployment with vLLM in it anymore. A whole layer of frameworks and operators has grown up for it: KServe, NVIDIA Dynamo, Ray Serve, Kthena, llm-d. Each one adds its own custom resource that describes a model deployment, with routing, autoscaling and the split of a model across pods built in, and each one turns that resource into ordinary Kubernetes objects in its own way.
None of those resources is an object a monitoring tool knows about. What it sees is what the frameworks create: Deployments named llama-disagg-prefill-6f8d9c and friends, a new set after every rollout. And every model server sits in SLO violation from the moment it starts, because a latency objective made for web services doesn't survive a request that takes four seconds on purpose.
So we ran all of them on one cluster and fixed both in Coroot. Here is what the frameworks actually build, where our first fix went wrong, and what Coroot does now.
The frameworks # #
KServe is the old guard. It started in Kubeflow, and one InferenceService can run any model on any runtime, with canary rollouts and scale-to-zero through Knative. Red Hat ships it in OpenShift AI. NVIDIA's NIM Operator can hand its prepackaged NIM containers to KServe to run.
NVIDIA Dynamo is for one big model spread across many GPUs and nodes. You pick the engine, vLLM, SGLang or TensorRT-LLM. Dynamo adds everything around it: a frontend that sends each request to the worker that already has its KV cache, separate prefill and decode pools, and a planner that resizes them.
Ray Serve is the serving part of Ray. A model is a Python class that runs as Ray actors, and classes can be chained into a pipeline. KubeRay runs the Ray cluster on Kubernetes. It is the natural pick when serving is more than one engine call and the glue is Python.
Kthena is the newest one, from the Volcano community, and built only for LLMs. It has prefill and decode roles, multi-node instances that are scheduled as a unit, and a router that works with models and versions instead of Services.
llm-d comes from Red Hat, Google and IBM, and it is the only one without a resource of its own. It is a set of recipes for vLLM plus a router from the Gateway API Inference Extension. The router picks a server by prefix-cache hits and load, and can split a request into a prefill pass and a decode pass on different pods. What lands on the cluster is stock Kubernetes: an InferencePool and either Deployments or a DisaggregatedSet from the LeaderWorkerSet project.
Five ways to turn a model into pods # #
A model deployment is more than one container: the engine, maybe a preprocessing step, a router, and in disaggregated setups several kinds of workers that only make sense together. Kubernetes has no object for that, so each framework invents one and maps it onto the objects Kubernetes does have. They map it differently:
- KServe turns each component of an
InferenceServiceinto a Deployment, or in serverless mode into a Knative Service that gets a fresh Deployment per revision,<name>-predictor-00002-deploymentafter a config change. ANIMServicehanded to KServe lands here as well. On its own it is a plain Deployment. - NVIDIA Dynamo expands a
DynamoGraphDeploymentinto a Deployment per component:<graph>-frontend,<graph>-prefill-<hash>,<graph>-decode-<hash>, the hash derived from the worker config. Between them the traffic isn't HTTP at all: requests go over a TCP request plane, KV cache GPU-to-GPU over NIXL, KV events through NATS. - Ray Serve creates a
RayClusterand manages its pods directly, no Deployment in between, and upgrades blue-green: a config change creates a second cluster with a new random suffix and switches traffic once it's healthy. - Kthena also creates pods itself, named by role and index like
<model>-<group>-prefill-<i>, gang-scheduled with Volcano. The same shape as LeaderWorkerSet, which vLLM uses for multi-node models. - llm-d borrows that project's newer
DisaggregatedSet: prefill and decode roles become one LeaderWorkerSet each, named<set>-<slice>-<revision>-<role>, and on a single host each of those is a Deployment of the same name. Change one role's config and the revision hash changes for the whole set, so every Deployment in it is replaced by a new one with a new name rather than rolled.
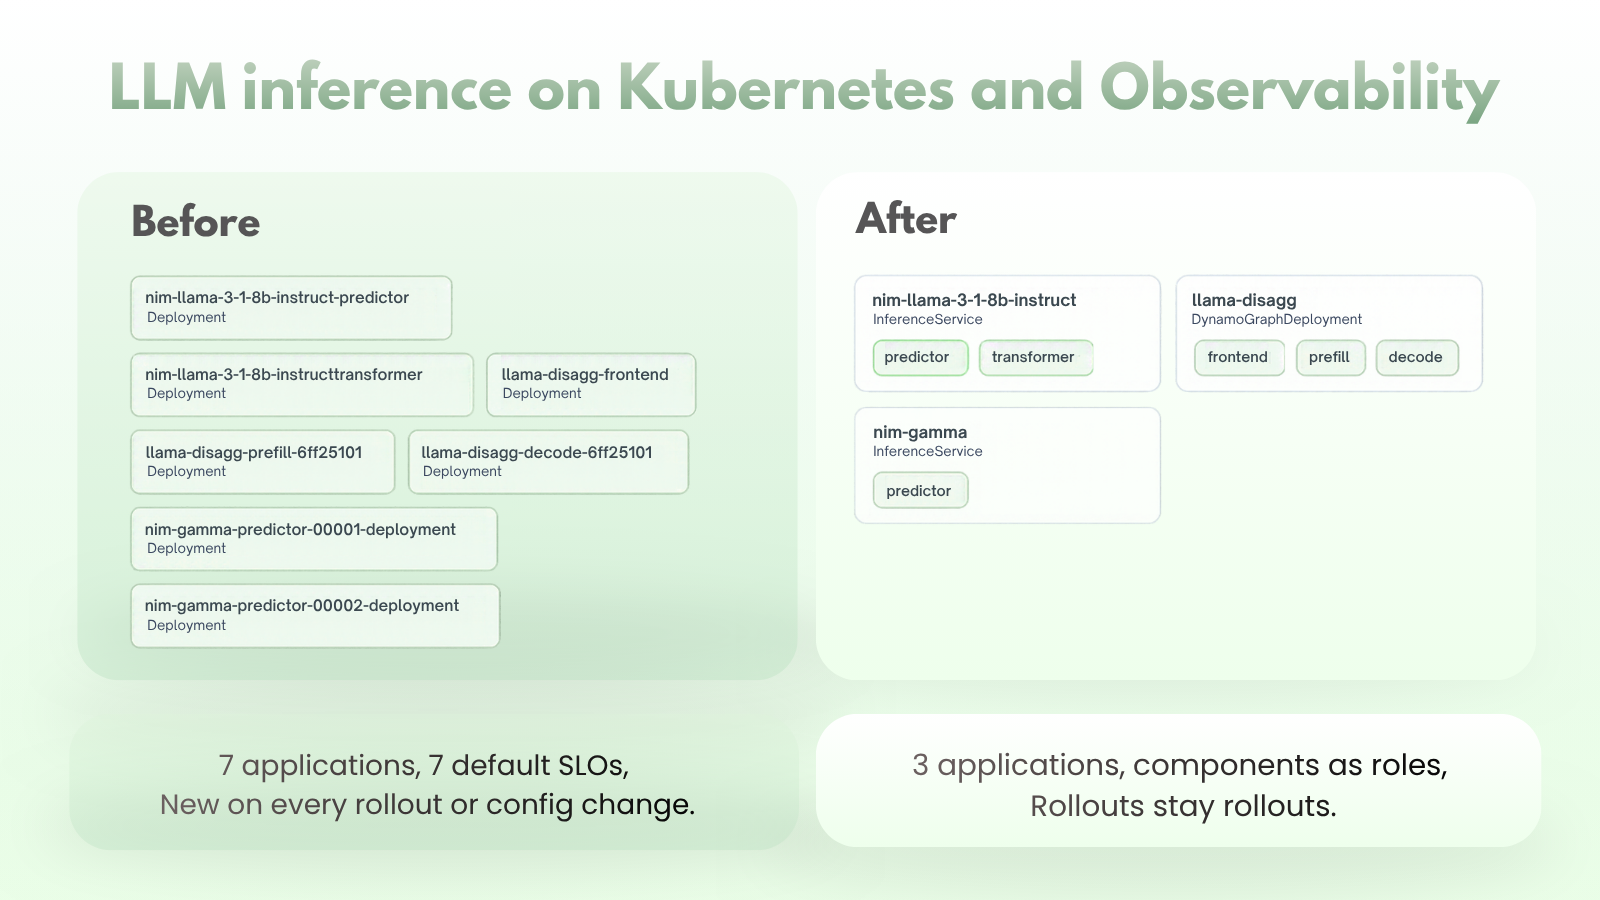
So there are really three patterns. Custom resource to Deployments (KServe raw, Dynamo, NIM, llm-d through LeaderWorkerSet). Custom resource to Knative to Deployments per revision (KServe serverless). Custom resource straight to pods (Ray, Kthena, multi-node LeaderWorkerSet), chosen whenever the pods are not interchangeable and need gang scheduling. In all three the unit you think in, the InferenceService or the graph or the ModelServing, is not an object Coroot knew about, and the objects it did know about have generated names that change on every rollout. Each rollout produced a "new" application on the map and an "old" one that went away, with the history of the model deployment split between them.
The good news is that the frameworks are not hiding any of this. Every pod carries labels that say which resource it belongs to and what role it plays, and the frameworks that create pods themselves set the custom resource as the pod's owner. That is all Coroot needs. It groups pods by that resource, so a Dynamo graph becomes one application with frontend, prefill and decode instances, an InferenceService becomes one application with a predictor and a transformer, and a RayCluster or a Kthena ModelServing becomes one application with no framework-specific code at all. Rollouts stop creating new applications. The Deployments underneath come and go, the application keeps its name, and its history stays in one place.
Milliseconds and seconds from the same port # #
Whatever is inside, every framework shows the same face to the outside: an OpenAI-compatible API, next to /health, /metrics and /v1/models, from one process on one port. Great for clients. Here is what that port looks like to anyone measuring it:
That is the inbound latency of a vLLM server, captured with eBPF, nothing filtered. The bottom band is the kubelet hitting /health and Prometheus scraping /metrics. The top band is /v1/chat/completions, a few seconds each, because generating tokens takes as long as it takes. Two kinds of work, three orders of magnitude apart, and nothing in between.
A latency histogram over both is a histogram over neither. Its percentiles depend on how many probes you get per prompt, and Coroot's default objective, 99% of requests under 500ms, is broken by every single prompt. That is why every model server landed in permanent SLO violation on day one.
Our first fix was the obvious one, and it even got committed: a relaxed default objective for anything that looked like an inference service. It lasted about a day. A vLLM server behind a plain Deployment doesn't look like an inference service, so it kept its 500ms. An API gateway that fronts both regular APIs and model endpoints has the same mixed traffic and isn't one either. And a 10-second objective is simply wrong: the model can get twice as slow before anything fires, while the health endpoint is now allowed ten seconds too. "Is the model slow" and "is the server slow" are different questions, and one histogram cannot answer both.
So the thing to classify is the request, not the server. The inference endpoints are a short, stable list: OpenAI chat, text completions and responses, Anthropic messages, Ollama, TGI, KServe v1 and v2, Triton over HTTP and gRPC. Coroot's agent already parses every HTTP request it sees, so a request to one of these becomes an LLM request with its own histogram, with buckets from 100ms to 10 minutes, and with latency measured to the first byte, which for a streaming completion is the time to first token. Errors still count: a 500 from a chat endpoint is a failed request like any other. Everything else stays in the regular histogram with the regular objective.
In Coroot that is two SLOs on one application. The regular latency SLO stops seeing LLM requests, and a second one, "LLM latency", appears on every application that serves them, with its own objective, 99% under 10 seconds by default, and its own burn-rate alerts and incidents:
The same split helps on the calling side. A service that talks to a model no longer has its dependency latency swamped by prompts, and the eBPF trace of each call carries the operation and the model name pulled from the request body, in OpenTelemetry GenAI terms, so you can see what an agent was talking to without instrumenting it:
Wrapping up # #
Two things changed in Coroot, and both came from looking at what the frameworks actually put on the cluster rather than at their resource names.
Model deployments are applications now. KServe, Dynamo, Ray Serve and Kthena each invent a top-level object for a model deployment, llm-d borrows one from LeaderWorkerSet, and all of them map it onto Kubernetes in one of three ways: Deployments per component, Knative revisions, or pods they manage directly. Whichever way, every framework labels its pods with the resource they belong to and the role they play, and Coroot groups by that. The map shows what was deployed, with the components as roles, instead of how the operator chose to implement it.
Model servers get an SLO that fits them. Health checks, metrics and model listings answer in milliseconds, prompts answer in seconds, and the same histogram cannot describe both. A relaxed objective was the wrong fix, because the fast endpoints get relaxed too and plain Deployments and API gateways never qualify. The right one is to classify requests by endpoint: LLM requests get their own histogram with buckets up to 10 minutes, latency measured to the first token, their own objective and alerts, and the regular SLO is left to the regular traffic.
All of this is in Coroot 1.28 with the latest agents, with nothing to configure. If your serving stack still doesn't line up on the map, or you have an endpoint the agent should recognize and doesn't, open an issue or find us on Slack. And if you like Coroot, give us a ⭐ on GitHub.