← All postsEngineering Every few weeks someone tells me root cause analysis is a solved problem now: pipe your telemetry into an LLM, let it tell you what broke. I wish it were that easy. After years on this, I think "can AI do RCA?" is the wrong question, because doing RCA with an LLM is really two separate jobs, and the answer is different for each. They break in completely different ways, so it's worth pulling them apart.
One is reasoning: can the model take the data in front of it and connect the dots? A service slows down. Three facts are on the table at once: it's starved of CPU, the node's CPU is maxed, and a neighbor on that node is eating all of it. A model that reasons ties them into one story, a noisy neighbor. A weaker one reports three unrelated "issues", or grabs the loudest symptom and calls it the cause.
The other is the harness: everything around the model. What data you put in front of it, in what shape. Usually it means tool-calling, letting the model decide what to fetch and when to stop. Plenty goes wrong here, and none of it is about whether the model could reason. It just never got the right data.
People mix these two up all the time. A model gives a bad answer, and everyone says LLMs can't do RCA. But usually the model just never got the data it needed. It's not that it couldn't reason, it never had a fair shot. And until you separate the two, you can't tell which one is the real problem.
Take the harness out of the picture # #
So we did, on purpose. With Coroot's AI RCA, we don't hand the model tools and send it off to investigate. Instead, a deterministic pipeline does the heavy lifting: it correlates the signals and turns them into findings. The model gets those findings in one focused context, not the raw telemetry. No tools, no agent loop. Everything it needs to find the answer is already there.
That boils the whole thing down to reasoning. If the model has the full context and still misses the root cause, there's no one else to blame. Not the harness, not missing data. Just the model. And that's finally something you can measure cleanly.
So here's the experiment. Take a real failure where the context already holds the answer, hand that same dump to a bunch of models, and see which ones can distill it into the actual root cause. No fetching, no deciding what to look at. Just reasoning. And it's harder than it sounds: even with the answer sitting in the data, there are traps in there that can walk a model straight into the wrong conclusion.
The test # #
I picked one scenario: a network delay between the catalog
service and its Postgres database, db-main
. The queries slow down, timeouts spread, and front-end
starts serving 502s. But nothing is actually wrong with the database or the service. The culprit is a Chaos Mesh NetworkChaos
experiment running in the cluster, injecting delay on the catalog
↔db-main
path, and it shows up right in the Kubernetes events. So the fix is to delete the experiment, and just as importantly, the schedule that would spin it right back up.
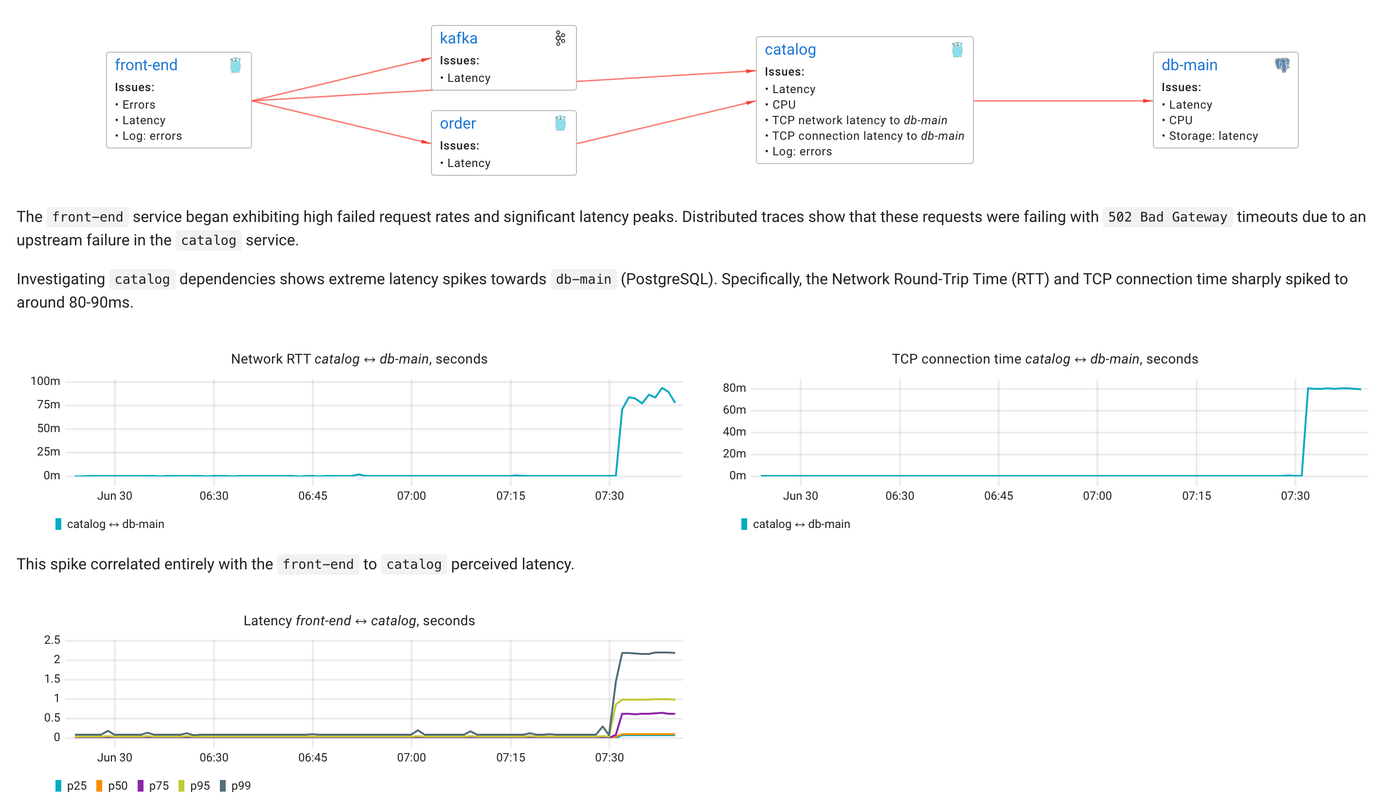
You can see the problem fan out: front-end
shows errors and latency, but tracing the dependency chain leads through catalog
, where the real signal lives, the TCP network and connection latency to db-main
.
Notice the map also flags things that aren't the root cause: latency on kafka
, CPU on catalog
and db-main
, storage on the database. In a distributed system one problem bleeds into metrics everywhere, and some of them point the wrong way. Take the database. When the round-trip time between catalog
and db-main
went up, the client started getting its query responses slower. But Postgres times a query from the first byte it receives to the last byte it sends back to the client, so that network delay gets counted as part of the query time. Read pg_stat_statements
and it looks like the database suddenly got slower at the exact same queries.
It didn't. The extra time was on the wire, not inside Postgres. A naive read blames the database and moves on, which is exactly the trap. And it isn't a bug that the pre-processing surfaces a signal like this. Telling a real cause from its downstream effects is the model's job in the next step, and it takes real reasoning. More data here isn't a problem, as long as the model can reason well enough not to be fooled by it.
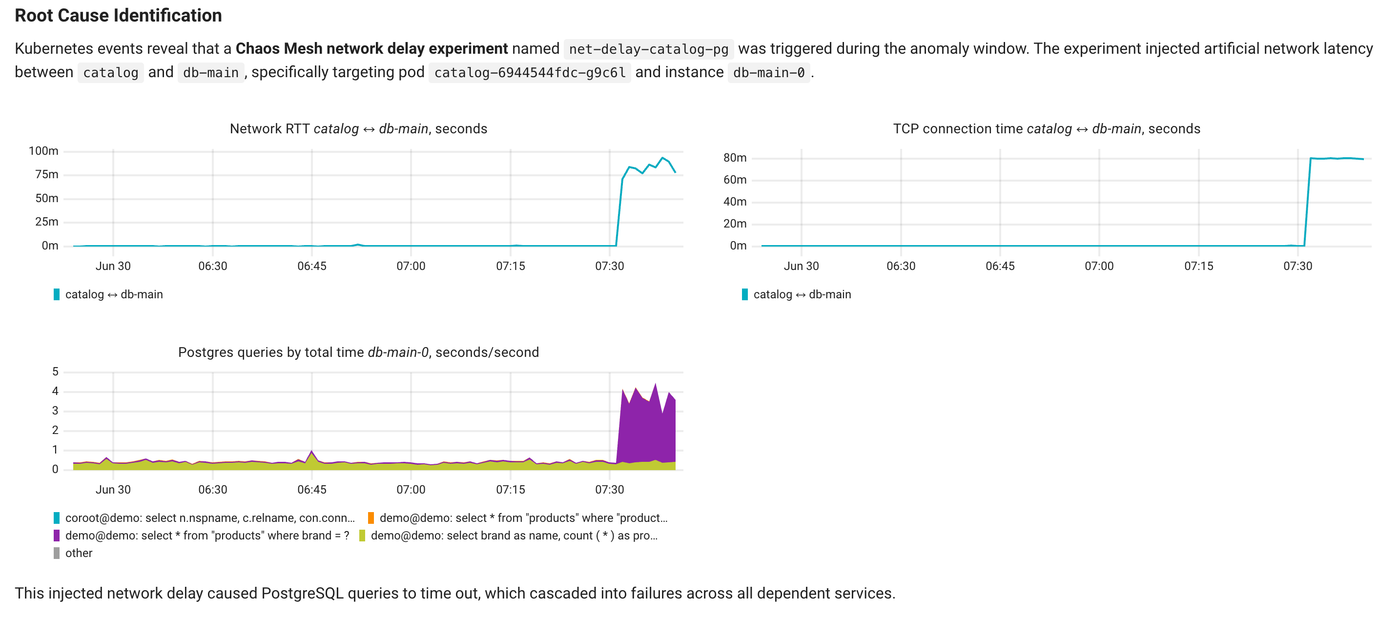
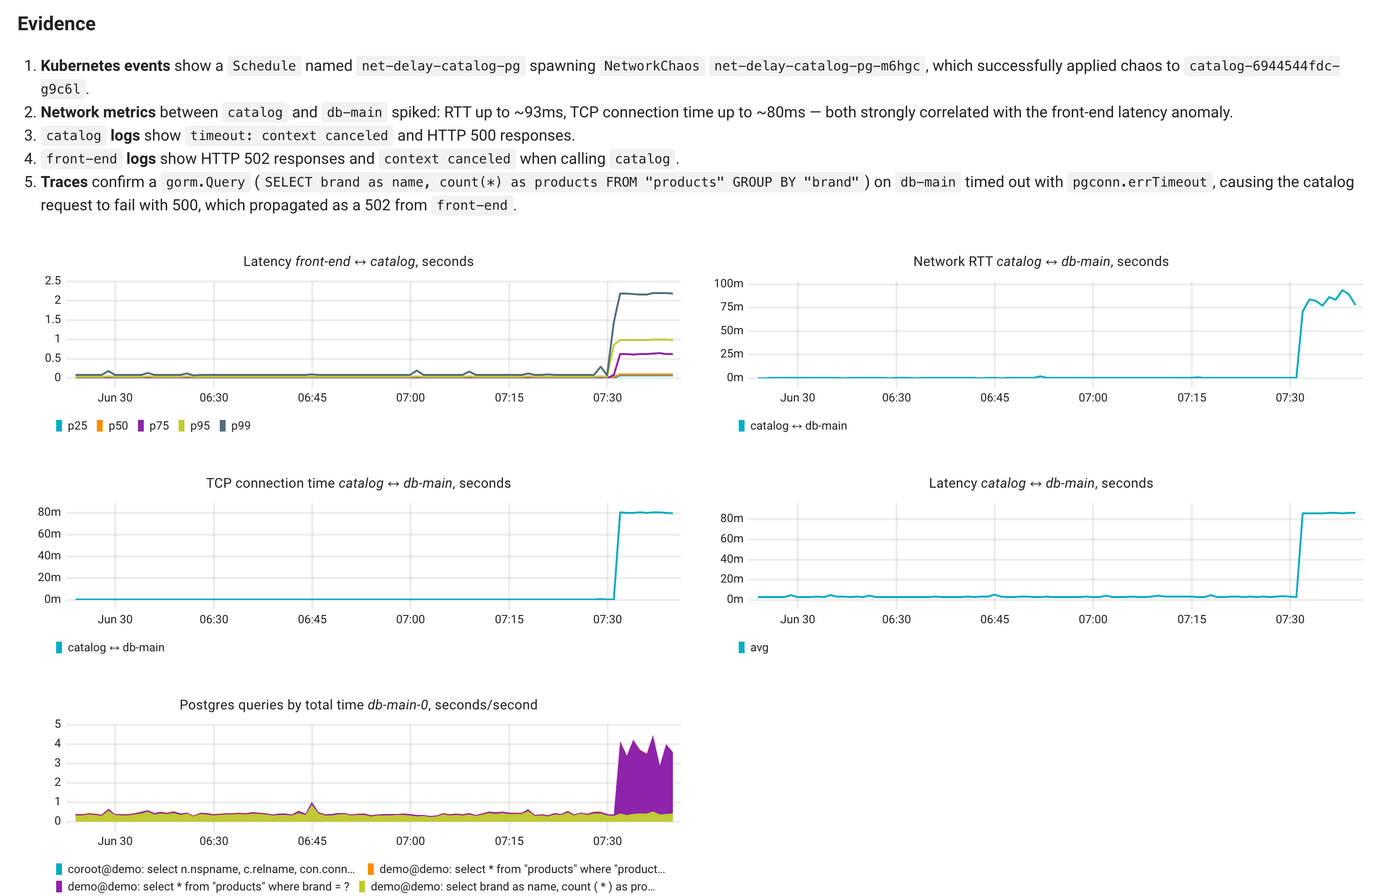
Alongside those traps, the real evidence is all there. Coroot traced the propagation path, found the network RTT to db-main
tracking the slowdown, and flagged the Kubernetes event showing the chaos experiment started right when things broke. The answer is right there in the prompt, nothing hidden, nothing behind a tool call.
I then reused that exact same prompt against every model, asking each the same three things: what's the root cause, what's the cause-and-effect chain, and what's the immediate fix.
No score, just pass or fail. I couldn't turn this into an honest number (how many points is a half-right explanation worth?), so the bar is simple: did it pin the chaos experiment, explain the ripple out to front-end
, and point at deleting both the experiment and its schedule?
What "right" looks like # #
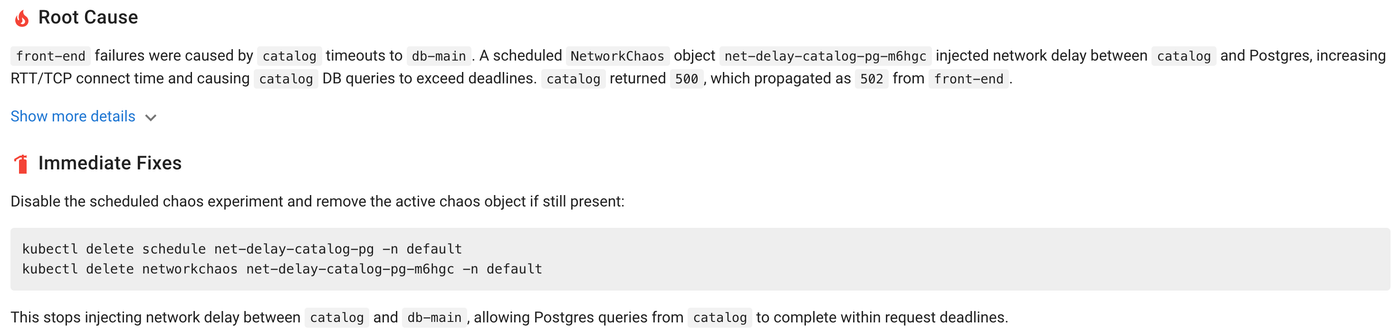
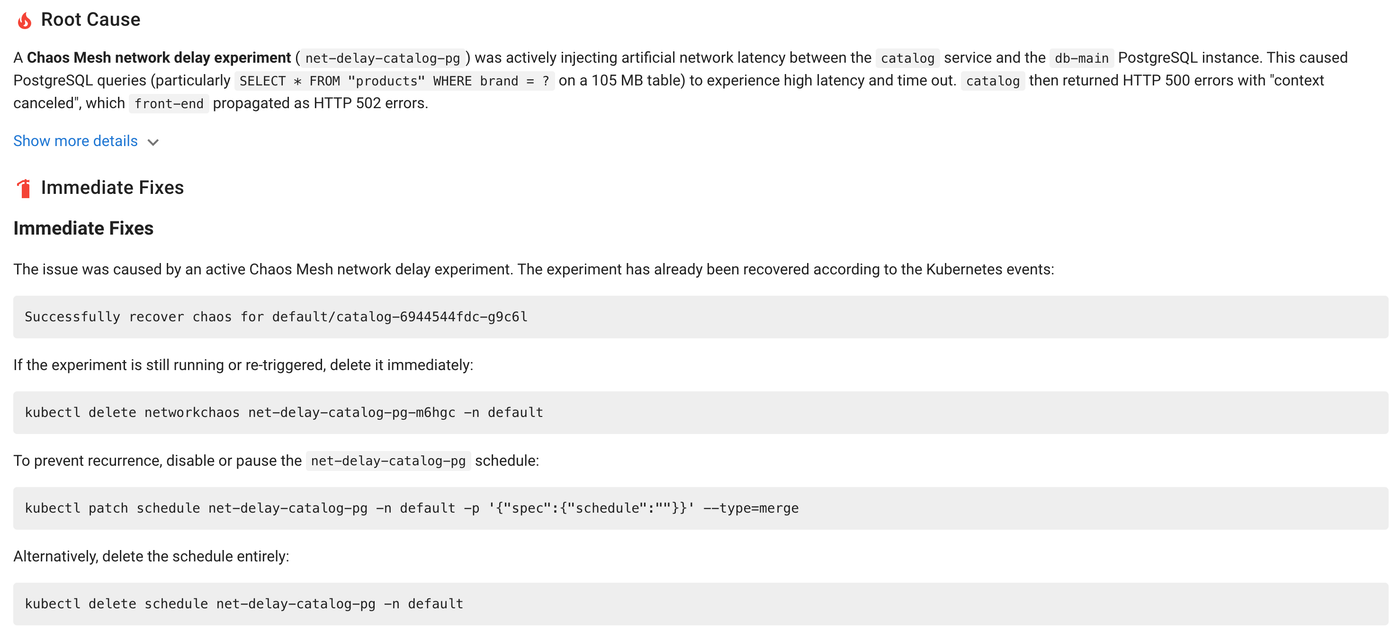
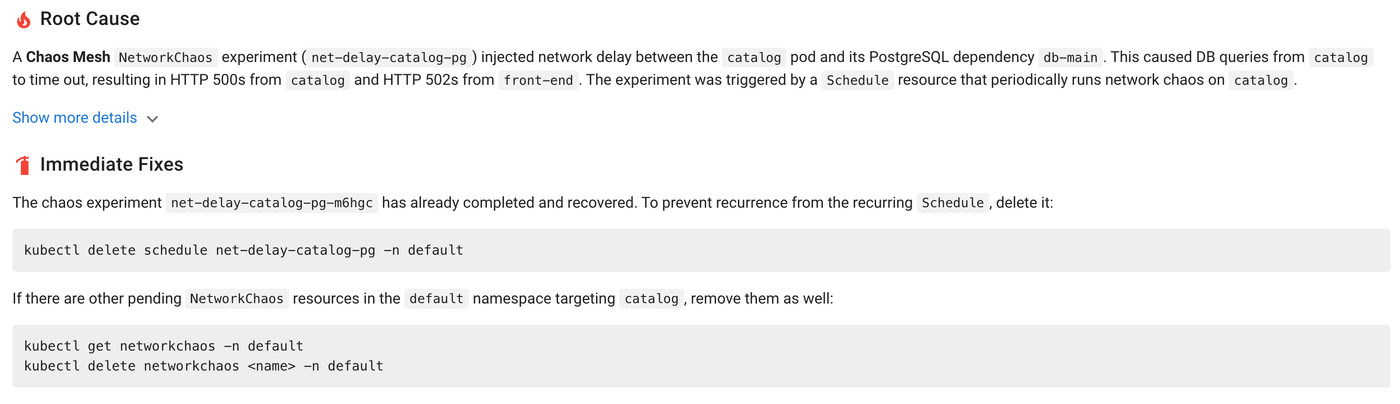
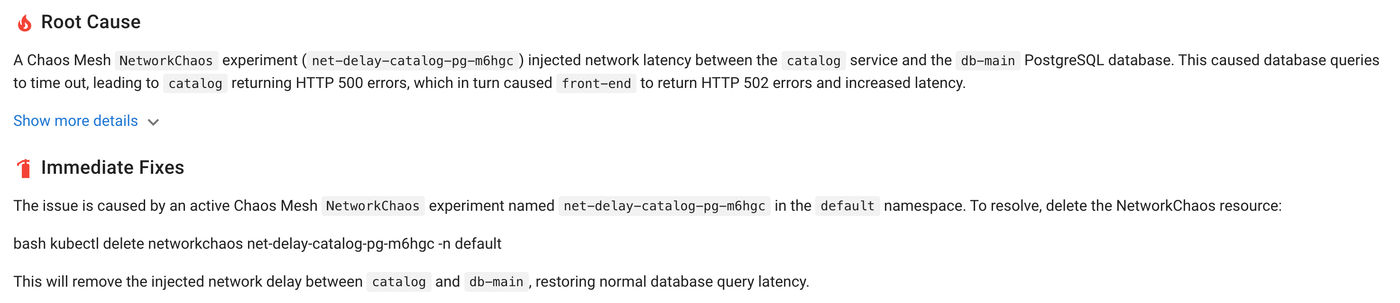
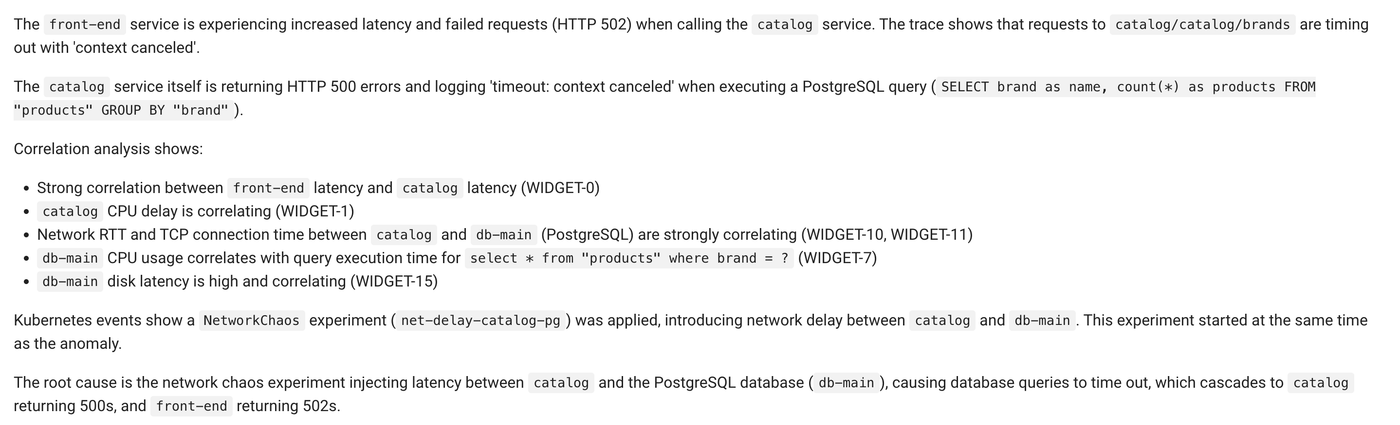
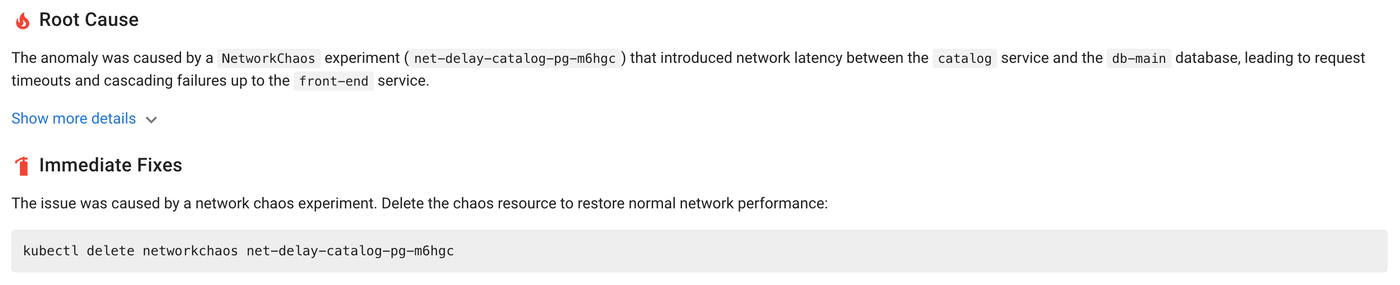
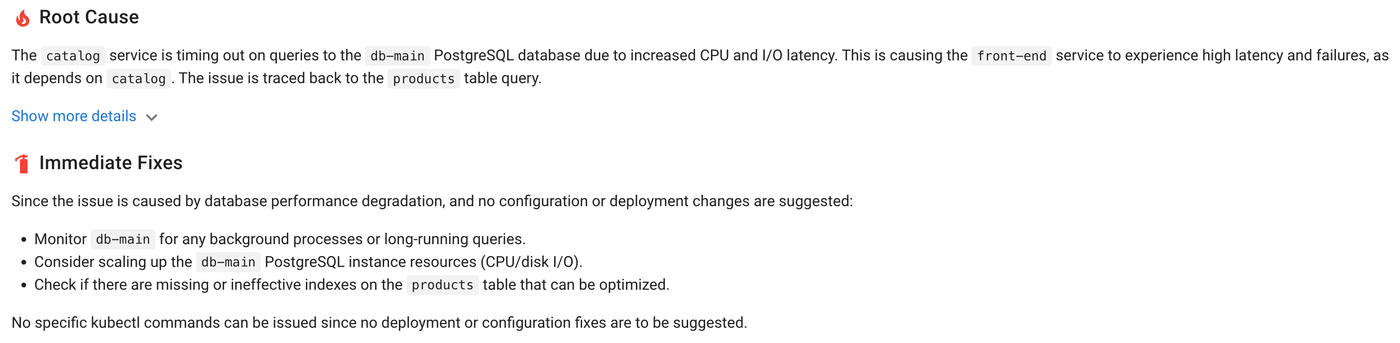
Here's the bar. Claude Opus 4.8 nails it.
The summary runs the chain in the right order: front-end
errors, back through catalog
's slow Postgres queries, back to the NetworkChaos
injecting delay, with the correlated RTT and TCP spikes cited as proof.
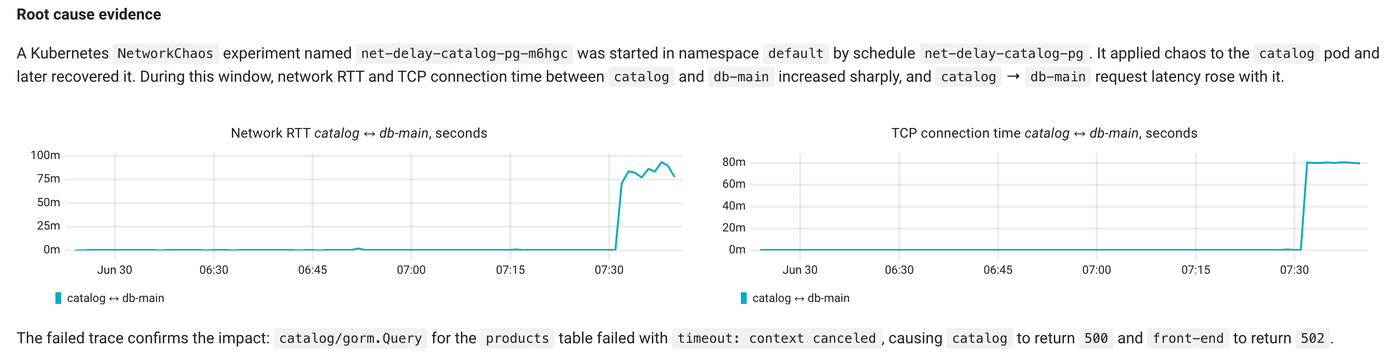
The evidence holds up: RTT and connection time climbing with the slow queries, the slow gorm.Query
spans, the Kubernetes events marking when the experiment started and recovered, plus a note that db-main
's CPU profile is clean, so this isn't a database problem.
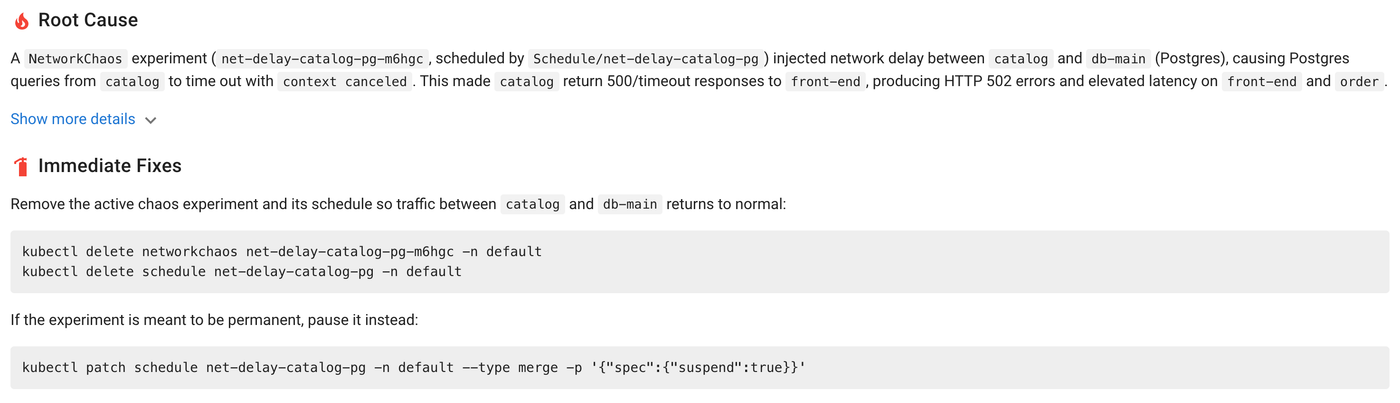
And the fix is actually useful: delete the experiment now to get connectivity back, then delete its schedule so it can't fire again. That second step is the easy one to miss, and exactly what you'd want to know at 3am.
Now let's see who else clears it.
Results # #
Eleven models, same context, one shot each. Input is ~9,800 tokens, output ~1,000, so the cost column is the real per-incident price.
Result key: ✅ correct root cause and a correct, complete fix. 🟡 found the root cause, but the fix was incomplete or it ignored the formatting instructions. ❌ missed the root cause, or the fix wouldn't actually work.
| Model | Result | Cost | Screenshots | Notes |
|---|---|---|---|---|
| Claude Opus 4.8 | ✅ | $0.0743 | ||
502s, and caught both fix steps.summary,evidencedb-main
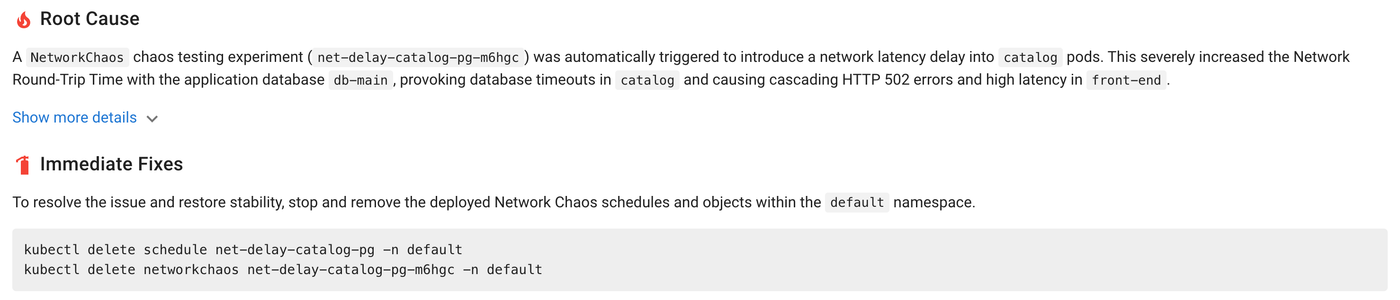
RTT spike to the 502s, both fix steps.summary,evidencesummary,evidenceSchedule
spawning the NetworkChaos
, and prioritized deleting the schedule to stop recurrence.summary,evidencebash
, and the fix skips the schedule.summary,evidencesummarysummary,evidencesummarysummary## What this tells us #

It helps to split the field three ways:
Closed frontier models: Opus 4.8, GPT-5.5, Gemini 3.1 Pro. We don't know their size, but almost certainly huge.** Big open-weight models**, the kind you'd still run in the cloud: DeepSeek V4, GLM-5.2, MiniMax M3, Nemotron 3 Ultra.** Small open-weight models**you could actually self-host: Gemma 4 31B and the Qwens.
No surprises at the top: all three frontier models passed cleanly, and the big open models mostly kept up.
The surprise was at the small end. Among the models you could realistically run on your own hardware, size barely mattered, and the standout was the smallest of the bunch: Gemma 4 31B was the only self-hostable model to find the root cause at all. The bigger Qwen3.6 35B and Qwen3 Coder Next both missed it. And going huge was no guarantee either: Nemotron 3 Ultra, at 550 billion parameters, only made the middle tier. If you want something you can run yourself, Gemma was the one to beat.
Look closer at who passed and who didn't, though, and the split comes down to two kinds of failure, only one of which is really about the model.
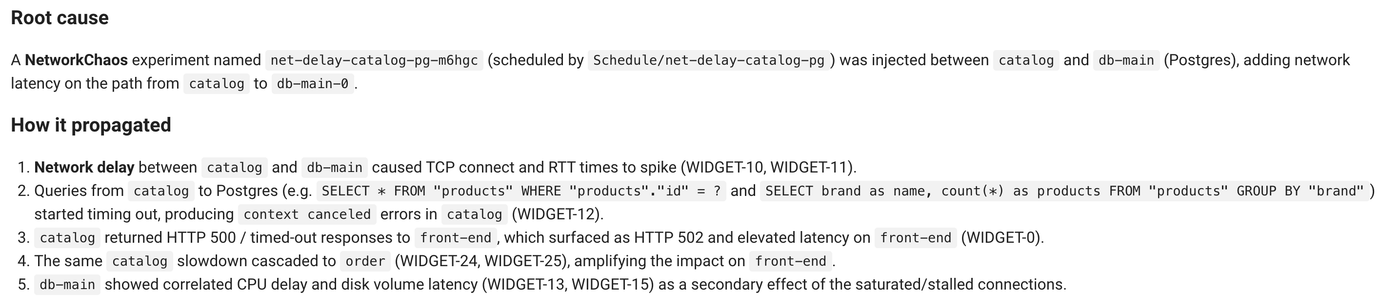
The ❌ cases are real reasoning failures. Qwen3 Coder Next saw slow queries and blamed the database, the obvious wrong answer, while the chaos event sat right there in the context. Qwen3.6 found the experiment but then deleted the wrong resource, handing back a command that wouldn't run. Both had everything they needed and still missed, and no harness can fix that.
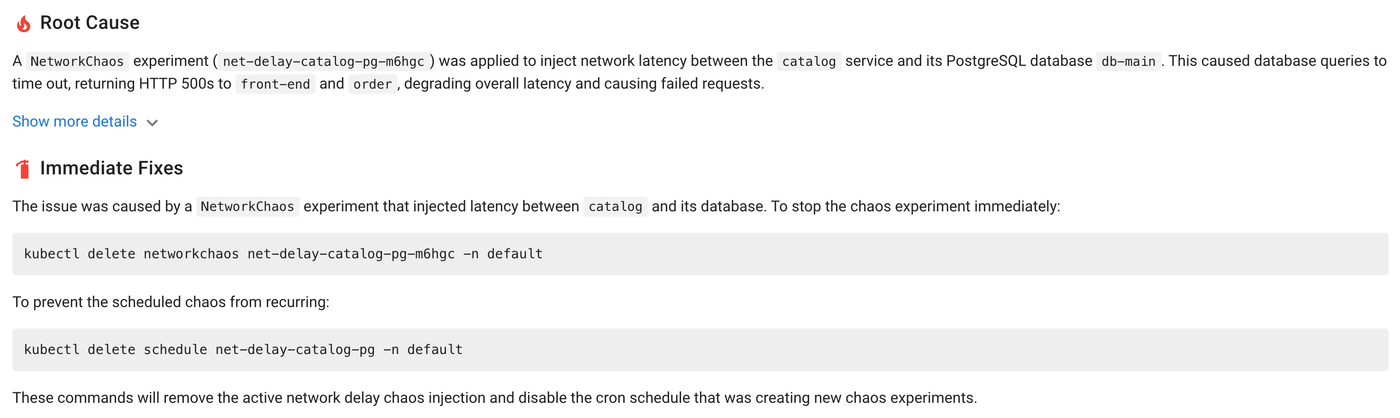
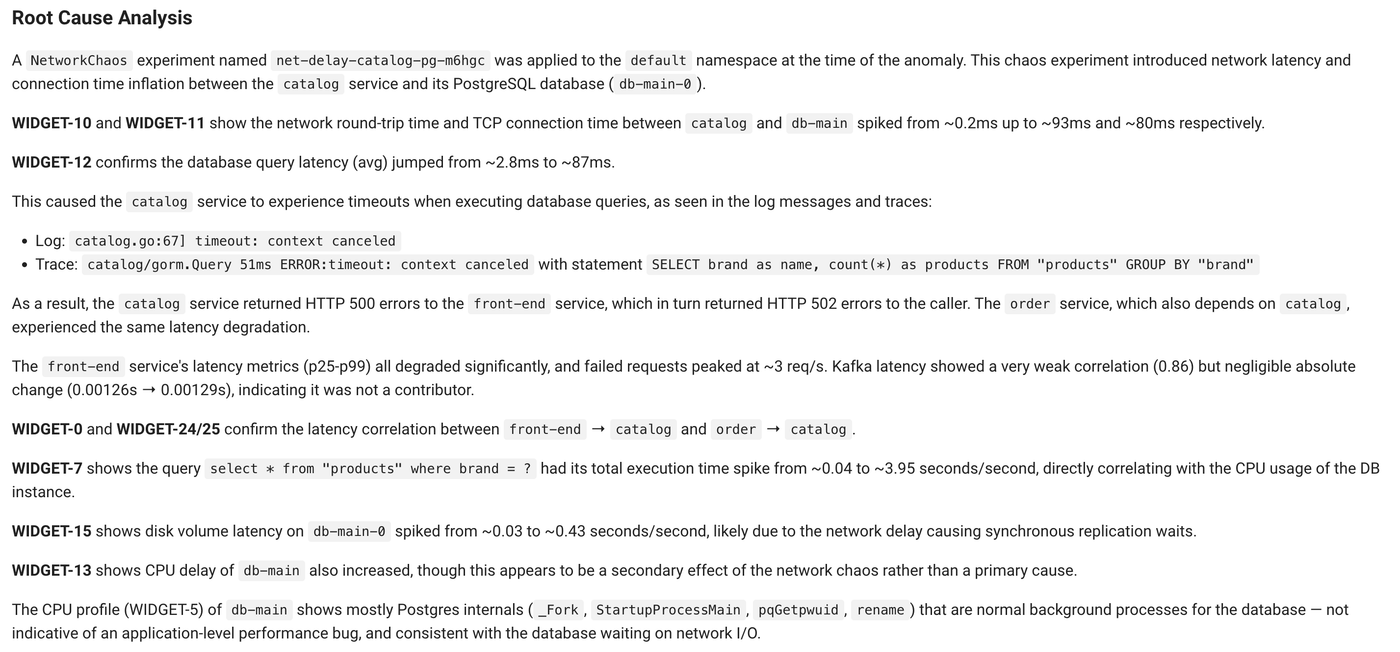
The 🟡 cases are more hopeful. They all got the reasoning right and only stumbled on packaging: raw widget IDs leaking into the evidence, a stray bash
in a code block, deleting the chaos object but not the schedule that recreates it. Those are formatting and instruction-following slips, the kind you fix on the harness side, not the model. For these models, the reasoning was fine.
A word on cost, since the table shows a big spread. At first glance the gap between models looks huge. But the LLM isn't analyzing raw telemetry here, that work is already done before it's called. It just reads a small, ready-made context and reasons over it, one short call of around 10k tokens. At that size even the most expensive frontier model runs a few cents per incident, which makes reaching for a top model look perfectly reasonable.
One incident isn't a benchmark, but it lines up with what we keep seeing. The reasoning part of AI RCA is basically solved: frontier models nail it, and even small models you can self-host do a decent job, though they're still not as predictable. Finding the root cause, once the context is there, isn't really the open problem anymore.
The hard part is the harness. Telemetry keeps growing fast, and if you hand all that raw data to an LLM to sort through, it gets slow and expensive in a hurry. So the real work isn't finding a smarter model. It's preparing the right, compact context for the model before you call it.