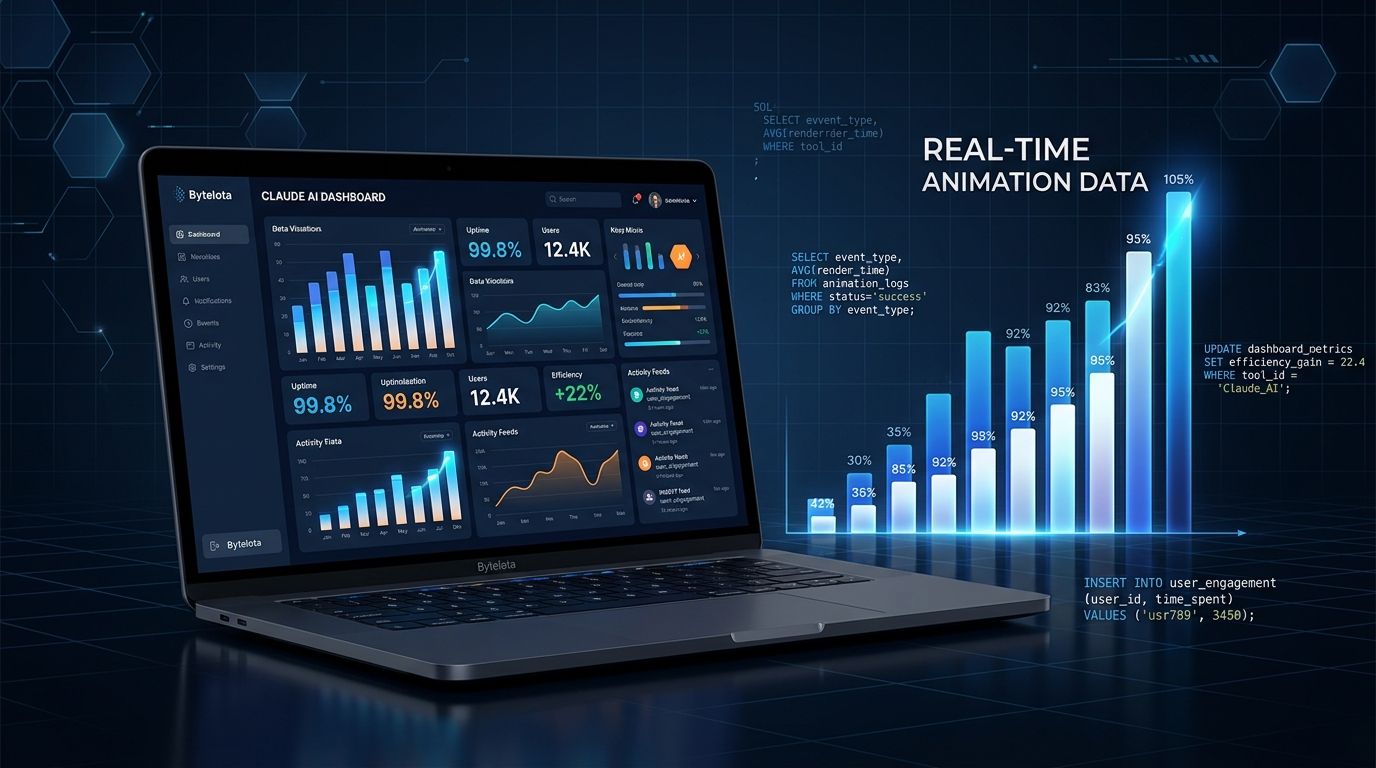
Anthropic shipped two new Claude features on October 8: Claude Dashboards, which connects to your data warehouse and builds live charts from plain-language questions, and Claude Motion, which turns reports and presentations into code-built animated explainers. Both are in beta. Neither is quite what the hype makes them sound like — and that gap is worth understanding before you reorganize your tool stack.
Claude Dashboards: The SQL Is the Point #
The headline is that you can ask Claude “show me signups by region this week” and get a live chart without opening Looker or filing a data ticket. That part is real. But the more important detail is what happens after: every chart shows the SQL query behind it. You can inspect exactly what Claude counted, how it filtered, and when the data last refreshed.
That transparency is what separates Dashboards from AI tools that generate charts as black boxes. It connects to Amazon Redshift, BigQuery, ClickHouse, Databricks, Snowflake, MongoDB, Salesforce, and Datadog. Looker, Tableau, and Perplexity are listed as “coming later.” Dashboards is available in beta on Pro, Max, Team, and Enterprise plans. Enterprise admins get it off by default and must enable it in Organization Settings.
The workflow is straightforward: connect a warehouse via the + menu in a chat, authenticate with OAuth, ask your question, and Claude writes the SQL, runs the query, and builds the dashboard. The charts stay current as the underlying data changes. For exploratory questions — comparing pipeline movements, monitoring launch metrics, pulling week-over-week numbers without a data team — this is genuinely useful.
What Dashboards Is Not #
Here is where the coverage gets thin. Claude Dashboards has no row-level security, no scheduled refresh with alerts, no audit logs, and no version history. The admin controls are all-or-nothing at the organization level — you cannot restrict which connectors individual artifacts can reach. Dashboards with live connections cannot be shared publicly; each viewer needs their own connected account, which means the data they see is scoped to their own access. Power BI is not on the export list.
Anthropic is not positioning this as a BI replacement, and The New Stack made the same point at launch. For anything governed — audited reporting, executive dashboards with controlled access, data pipelines with SLAs — your existing BI stack stays. Tableau, Metabase, and Looker are not in danger. What Dashboards is good for is the exploratory middle layer: the question that needs an answer now, not next sprint.
Claude Motion: Animations Built From Code, Not AI Video #
Claude Motion is stranger and more interesting than it sounds. When you type /motion in the message box and describe what you want, Claude does not call a video generation model. Instead, it writes code that animates your text, shapes, charts, and images frame by frame. The result is fully editable: change a word, adjust a timing, swap a number, and the rest of the animation stays intact. Export is MP4.
That distinction matters. AI video generators produce footage you cannot edit at the source level; Motion produces code you can inspect and modify. The practical ceiling is narrow — short explainers, animated charts for board decks, product walkthroughs for onboarding — but within that range the output is more controllable than anything in the generative video space. Motion is available to Team and Enterprise plans in beta. Pro and Free users do not get it.
The Bigger Platform Shift #
Dashboards and Motion did not launch in isolation. On the same day, Anthropic moved Claude Docs, Slides, and Design out of beta and onto every plan, including Free. More than 45 million documents, decks, and designs have been created with Claude artifacts since their introduction. Team collaboration is now live: your team and Claude can edit the same doc, deck, or dashboard together. Mobile editing is supported.
The pattern is clear. Anthropic is building Claude from a chatbot into a workspace — one that connects to your data, generates your presentations, and now animates your reports. Whether that workspace eventually displaces dedicated tools or sits alongside them depends on how quickly Anthropic closes the governance gap in Dashboards and expands Motion’s output quality.
The Honest Verdict #
Use Claude Dashboards for ad-hoc exploration: quick answers from your warehouse, questions the data team doesn’t have time for, first-pass charts you’ll refine elsewhere. Do not use it as your system of record, for any report that needs an audit trail, or anywhere row-level security matters. For those workflows, your BI stack still owns the job. Claude Motion is a real tool for a specific job: teams that need short animated explainers but don’t have motion designers or the patience for After Effects. The code-editable output is a genuine advantage over black-box video generators. If you’re on Team or Enterprise, it’s worth a look at your next board presentation.
Dashboards and the full artifacts suite are documented at the official Anthropic release page. Enterprise configuration options are in the artifacts admin guide. For a deeper limitations breakdown, the eesel.ai review covers the governance gaps in detail.