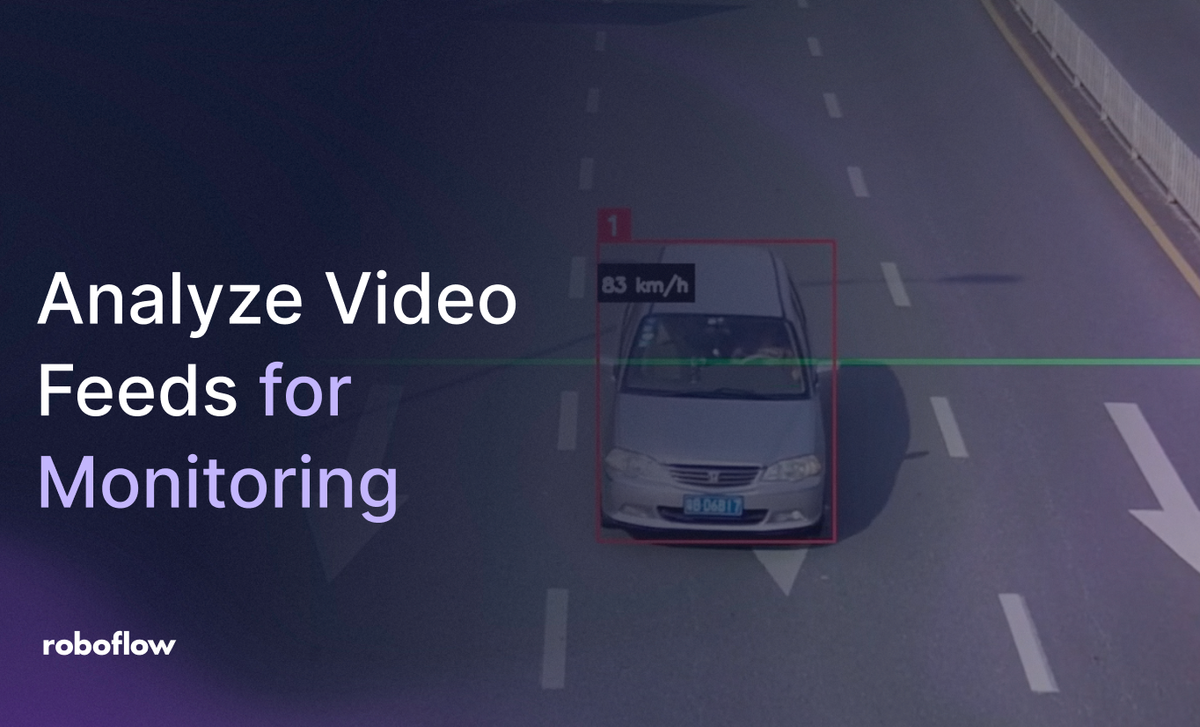
Video process monitoring automates the extraction of actionable operational data such as object counts, throughput, and speed, from raw camera feeds without requiring manual observation. By combining RF-DETR for object detection, ByteTrack for persistent tracking, and custom counting logic within Roboflow Workflows, you can easily build and deploy a real-time analytics pipeline for manufacturing, logistics, and more.
Analyzing video feeds for process monitoring means using computer vision to turn raw camera footage into operational data: counts, throughput, speed, and alerts, with no person watching a screen. In this tutorial, you'll build a working process monitoring pipeline in Roboflow Workflows, combining RF-DETR for detection, ByteTrack for tracking, and a line counter to measure flow.
We'll demo it on a highway CCTV feed, a process where the stakes are high: road crashes cause around 1.19 million deaths annually and cost most countries about 3% of GDP, per WHO. But the same pipeline monitors parts on a conveyor, packages in a warehouse, or people in a work zone. By the end, you'll have a workflow that detects objects, assigns persistent tracking IDs, and counts each one crossing a defined line.
How to Analyze Video Feeds for Process Monitoring with Roboflow #
A CCTV feed is processed frame by frame. RF-DETR detects vehicles, ByteTrack tracks them with unique IDs, and the Line Counter increments when a vehicle crosses the line.
RF-DETR: Detects vehicles and returns labels, boxes, and confidence.ByteTrack: Tracks vehicles and prevents double counting.Line Counter: Counts each vehicle crossing once.
This setup works best for fixed cameras with consistent vehicle movement. Heavy occlusion or multiple angles require a specialized multi-camera tracking system.
Dataset
The dataset for this tutorial is available on
__Roboflow Universe__Fork the dataset into your own Roboflow workspace to get started. The fork copies the images and annotations into your account so you can generate a versioned dataset and train directly from it.
The dataset comes with a train, validation, and test split already defined. The train split is used for model training, the validation split for tuning, and the test split is held out for evaluation.
Train RF-DETR
Go to the Versions tab in your forked project and generate a new dataset version. Once the version is generated, click Custom Train and select RF-DETR Small. Training runs through Roboflow's hosted pipeline with no local GPU or setup required.
Roboflow will show a summary of the training configuration before starting, including the model size, dataset version, split counts, and estimated training time.
Click Start Training. Once training completes, copy the model URL and proceed to the Build the Workflow section.
Build the Workflow
Here's the workflow we'll build.
What each block does
Object Detection Model: Detects vehicles in each frame and returns a bounding box, class label, and confidence score.ByteTrack: Tracks vehicles across frames with a unique ID to prevent double counting.Velocity: Estimates vehicle speed in km/h using pixel movement and a pixels-per-meter calibration.Line Counter: Increments the count when a tracked vehicle crosses the defined line.Class Line Count: Keeps a running total for each vehicle class.Line Counter Visualization: Displays the counting line and live counts on the video.Bounding Box Visualization: Draws a box around each detected vehicle.Label Visualization: Shows the tracking ID above each vehicle.Speed Label Visualization: Displays the estimated speed on each vehicle.Roboflow Vision Events: Logs detections, counts, and speed data for every processed frame.
Step 1: Create a new Workflow
Open the Workflows tab in your Roboflow workspace and click Create Workflow. Select Custom Workflow. Roboflow automatically adds an Image Input block and an Outputs block to the canvas.
The Image Input block is the entry point for every frame of the video. All subsequent blocks connect to it directly or through the chain of preceding blocks.
Step 2: Add the vehicle detector as an Object Detection Model block
Add an Object Detection Model block named vehicle_detector. Connect Image to inputs.image
and add your model URL.
Set:
- Confidence: Custom (0.4)
- Classes: car, bus, motorcycle, motorbike
- IoU: 0.3
- Max Detections: 300
Only detections above 0.4 confidence are passed to ByteTrack in the next step.
Step 3: Add a ByteTrack Tracker block
Add a ByteTrack Tracker block named byte_tracker. Connect Image to inputs.image
and Detections to vehicle_detector.predictions
.
Set:
- IoU Threshold: 0.1
- Consecutive Frames: 2
- Lost Track Buffer: 30
- Activation Threshold: 0.7
- High Confidence Threshold: 0.6
Minimum Consecutive Frames is set to 2, which filters out false positives before the tracker assigns an ID. Lost Track Buffer is set to 30, keeping tracks alive through brief occlusions.
Step 4: Add a Velocity block
Add a Velocity block named speed_estimation. Connect Image to inputs.image
and Detections to byte_tracker.tracked_detections
.
Set:
- Smoothing Alpha: 0.5
- Pixels Per Meter: 8
Pixels Per Meter is set to 8, converting pixel movement into real-world distance. Calibrate this value against your scene for accurate speed estimates. Smoothing Alpha is set to 0.5, which reduces speed fluctuations between frames.
Step 5: Add a Line Counter block
Add a line_counter block. Connect image to inputs.image
and detections to speed_estimation.velocity_detections
.
Line coordinates: [[0,360],[1280,360]]
Set Triggering Anchor to CENTER.
Line is placed at the frame center. Adjust the y-coordinate as needed. Counts increase once per vehicle crossing.
Step 6: Add a Class Line Count block
Add total_count Custom Python block. Connect image to inputs.image
and detections to Line Counter.
Outputs: display_text
, counts
, total
.
Click Edit Code to open the code editor. The block needs three inputs, three outputs, and the Python code below.
Paste the following:
def run(self, image, detections_in, detections_out, class_names):
    video_id = "default"
    try:
        meta = getattr(image, "video_metadata", None)
        if isinstance(meta, dict):
            video_id = str(meta.get("video_identifier") or meta.get("id") or "default")
        elif meta is not None:
            video_id = str(getattr(meta, "video_identifier", None) or getattr(meta, "id", None) or "default")
    except Exception:
        pass
    classes = [c.strip() for c in class_names.split(",")] if isinstance(class_names, str) else [str(c) for c in (class_names or ["car", "truck", "bus", "motorcycle"])]
    if not hasattr(self, "state"):
        self.state = {}
    state = self.state.setdefault(video_id, {"seen": set(), "counts": {c: 0 for c in classes}})
    for c in classes:
        state["counts"].setdefault(c, 0)
    def norm(name):
        v = str(name or "").strip()
        return "motorcycle" if v == "motorbike" else v
    def update(dets):
        if dets is None or len(dets) == 0:
            return
        names = list(dets.data.get("class_name", [])) if hasattr(dets, "data") else []
        tids = getattr(dets, "tracker_id", None)
        cids = getattr(dets, "class_id", None)
        for i in range(len(dets)):
            cls = norm(names[i] if i < len(names) else (cids[i] if cids is not None and i < len(cids) else "unknown"))
            if cls not in state["counts"]:
                continue
            tid = int(tids[i]) if tids is not None and i < len(tids) else None
            key = f"{cls}:{tid}" if tid is not None and tid >= 0 else f"{cls}:untracked:{i}"
            if key not in state["seen"]:
                state["seen"].add(key)
                state["counts"][cls] += 1
    update(detections_in)
    update(detections_out)
    counts = {c: int(state["counts"].get(c, 0)) for c in classes}
    total = sum(counts.values())
    text = "Vehicles crossed by class:\n" + "\n".join(f"{c}: {counts[c]}" for c in classes)
    return {"display_text": text, "counts": counts, "total": total}
Tracks class counts using IDs to avoid duplicates and maps motorbike to motorcycle.
Step 7: Add a Bounding Box Visualization block
Add a bounding_box_visualization block. Connect image to line_counter_visualization.image
and predictions to speed_estimation.velocity_detections
.
This draws a colored box around every detected vehicle on the output frame.
Step 8: Add a Label Visualization block
Add tracker_id_labels block. Connect image to bounding_box_visualization.image
and predictions to byte_tracker.tracked_detections
. Set text to Tracker ID.
Settings: Copy Image enabled, palette DEFAULT, size 10, colors #FF0000, #00FF00, #0000FF.
This writes the tracking ID above each bounding box so individual vehicles can be followed visually across frames.
Step 9: Add a Speed Label Visualization block
Add a Custom Python block named speed_label_visualization. Connect Image to tracker_id_labels.image
and Predictions to speed_estimation.velocity_detections
.
The block has one output: image
.
Open Edit Code. Set:
Block Type: Speed Label VisualizationDescription: Draws vehicle speed labels using Velocity data.
Paste the following:
def run(self, image, predictions):
    arr = image.numpy_image.copy()
    try:
        n = len(predictions)
    except Exception:
        n = 0
    if n == 0:
        return {"image": WorkflowImageData.copy_and_replace(origin_image_data=image, numpy_image=arr)}

    boxes = getattr(predictions, "xyxy", [])
    speeds = (getattr(predictions, "data", {}) or {}).get("velocity", None)
    h, w = arr.shape[:2]
    font, scale, thickness = cv2.FONT_HERSHEY_SIMPLEX, 0.55, 2

    for i, box in enumerate(boxes):
        if speeds is None or i >= len(speeds):
            continue
        try:
            label = f"{float(speeds[i]) * 3.6:.0f} km/h"
        except Exception:
            continue
        x1, y1 = int(round(box[0])), int(round(box[1]))
        x = max(0, min(w - 1, x1))
        y = max(40, min(h - 5, y1 + 46))
        (tw, th), bl = cv2.getTextSize(label, font, scale, thickness)
        cv2.rectangle(arr, (x, max(0, y - th - bl - 6)), (min(w-1, x + tw + 8), min(h-1, y + bl + 4)), (0, 0, 0), -1)
        cv2.putText(arr, label, (x + 4, y), font, scale, (255, 255, 255), thickness, cv2.LINE_AA)

    return {"image": WorkflowImageData.copy_and_replace(origin_image_data=image, numpy_image=arr)}
The block reads velocity data and displays each vehicle's speed in km/h at the top of its bounding box on the output frame.
Step 10: Add a Roboflow Vision Events block
Add a vision_events block. Connect image, output image, and predictions to their respective inputs.
Set:
-
Event Type: Inventory Count
-
Use Case: Traffic Vehicle Counting
-
Location: traffic_camera
-
Item Count:
total_count.total -
Item Type: vehicle_by_class
-
Cooldown: 1
This block logs each processed frame with its detections, per-class counts, and speed data. It does not affect the workflow output.
Step 11: Configure Outputs
Add the following outputs to the Outputs block:
output_image fromspeed_label_visualization.image
tracked_predictions fromspeed_estimation.velocity_detections
count_in fromline_counter.count_in
count_out fromline_counter.count_out
class_vehicle_counts fromtotal_count.counts
vision_events_status fromvision_events.message
total_vehicle_count fromtotal_count.total
speed_predictions fromspeed_estimation.velocity_detections
Once all blocks are connected, the full pipeline looks like this:
Click Save and then Publish to make the workflow ready to run against your test video.
Analyze Video Feeds for Process Monitoring Results #
Test video: Highway CCTV footage
The workflow processes frames in real time. Vehicles are detected and tracked with ByteTrack IDs. The counting line increments when a vehicle crosses it, while speed estimates appear above each bounding box.
The JSON output contains each vehicle’s bounding box, confidence score, tracker ID, and class label.
Each detection confirms vehicle classification and consistent tracking IDs across frames.
Production Deployment
Deploy the workflow via Roboflow Inference to run it against live CCTV feeds or recorded highway footage. Roboflow Inference supports deployment on edge devices, cloud servers, and local machines.
Every frame logged by Vision Events becomes a structured data point containing the vehicle class, count, speed estimate, timestamp, and image. Over time, these records reveal traffic patterns, such as peak truck activity or recurring congestion areas.
As more real-world detections are collected, the dataset grows automatically and can be used to retrain the model, improving performance on unseen vehicle types and camera angles. Scaling from one camera to many only requires adding new inputs while keeping the same workflow.
Where Video Process Monitoring Is Used #
The detect-track-count pattern in this tutorial is the core primitive of real-time video analytics. Swapping the model and the counting logic adapts it to most industrial processes.
Manufacturing: Point the workflow at a production line to count parts, measure throughput, and flag anomalies like stalled conveyors or missing components. The line counter becomes a cycle counter; Vision Events becomes your production log. See how teams apply this in computer vision for manufacturing and industrial manufacturing.
Logistics and warehousing: The same pipeline counts packages crossing a sortation line, tracks pallets between zones, and monitors dock activity from existing CCTV or RTSP streams. Explore vision AI for logistics and warehousing.
Safety monitoring: Replace the vehicle detector with a PPE or person model to alert on missing helmets, restricted-zone entries, or near-misses between forklifts and workers. Here's a full walkthrough of PPE detection with RF-DETR.
In each case the workflow stays the same; only the trained model, the line placement, and the event logic change.
Analyze Video Feeds for Process Monitoring with Roboflow Agent #
Instead of assembling this workflow block by block, you can describe your video analysis task to Roboflow Agent in plain English, such as "count vehicles crossing a line and estimate their speed," and it builds, configures, and tests the pipeline for you. The same approach works for any video feed, whether you're monitoring a production line, a dock, or a highway: describe the process you want to monitor, and the Agent assembles the detection, tracking, and counting logic.
What is video process monitoring?
Video process monitoring uses computer vision models to analyze camera feeds and extract operational data, such as object counts, throughput, speed, and anomalies, in real time. It replaces manual screen-watching with structured, queryable events.
Can this workflow run on live CCTV or RTSP streams?
Yes. Roboflow Inference accepts RTSP streams and webcam feeds as video inputs, so the same workflow you test on recorded footage runs against live cameras without changes.
What hardware do I need?
Training runs on Roboflow's hosted infrastructure, so no local GPU is required. For deployment, workflows run in the cloud, on a local server, or on edge devices like an NVIDIA Jetson. A GPU improves frame rates on high-resolution streams but isn't required for lower-throughput feeds.
Do I need to train a custom model?
Not always. Pre-trained models on Roboflow Universe cover common objects like vehicles and people. Train a custom RF-DETR model when your process involves domain-specific objects, unusual camera angles, or classes the base models miss.
Get Started #
This workflow processes a highway CCTV feed by detecting vehicles with RF-DETR, tracking them with ByteTrack, estimating their speed, and counting each vehicle as it crosses a defined line.
The pipeline structure stays the same regardless of what you add. Expanding coverage to new vehicle types only requires labeled data and retraining.
Roboflow Workflows, RF-DETR, and Roboflow Inference provide the tools needed to scale this from a tutorial into a production traffic monitoring system.
Further Reading
Cite this Post
Use the following entry to cite this post in your research:
Mostafa Ibrahim. (Jul 14, 2026). Analyze Video Feeds for Process Monitoring with RF-DETR. Roboflow Blog: https://blog.roboflow.com/analyze-video-feeds-for-process-monitoring/