Introduction #
The recent acquisition of OpenRouter by Stripe took me back to my days working at a networking company that built routers and gateways. Debugging networking software was a breeze thanks to Wireshark that captures the trace to help triage issues or just for observability. More recently, while building a service to analyze agent interactions, I found myself looking for a similar solution for agents: something that could capture the complete interaction trace. As a quick prototype, I tried a few solutions and wanted to share it through this post for anyone who wants to try it at home.
In my earlier post, I talked about the Token Tax much before the term token maxing became popular. In order to tighten our token budget, we need to first measure how the tokens are being used by analyzing what gets included in the context, the number of tools and the number of times each of these are invoked, and the number of turns it took for the LLM to provide a final response. These help us estimate the cost and latency to get a job done. Logs can tell you that an agent made a tool call. A trace can tell you why, with what context, how many times, and what it cost.
Agent Trace #
A wireshark captures a request and response but an agent trace captures the entire agent loop. An agent trace captures the complete execution path of an agent from the initial user prompt to the final response. Beyond the conversation itself, it includes session metadata, model requests and responses, tool activity, execution timings, token usage, latency, and other operational metrics.
A conversation may span multiple turns, and each turn may involve one or more tool invocations. As shown in the diagram below, the agent operates in a loop where the model generates a response, decides whether additional actions are required, invokes tools, processes the results, and then continues reasoning until it can produce a final answer. Capturing each step in this workflow provides the visibility needed to understand cost, latency, tool utilization, and context growth throughout the session.
A typical trace records:
• User prompts
• System and developer instructions
• LLM requests and responses
• Tool requests and responses
• Token consumption
• Latency and execution time
• Cost estimates
• Session and conversation metadata
Where to Capture the Trace #
The most obvious place to capture an agent trace is within the harness itself. Since the harness is responsible for orchestrating model calls, tool execution, conversation state, and memory management, it has complete visibility into the lifecycle of an agent interaction. Most modern agent frameworks and coding harnesses, including Claude Code, Codex, Kiro, and others, provide lifecycle hooks that can be used to capture events before and after model and tool invocations.
Source: https://www.langchain.com/blog/deep-agents-vs-langchain-vs-langgraph Harness based tracing provides the richest view of execution because it can observe not only model requests and responses, but also orchestration decisions, state transitions, memory operations, and other runtime events that may never be exposed outside the harness. The challenge, however, is that these hooks are not standardized and each framework implements them differently. As organizations adopt multiple harnesses and agent frameworks, maintaining custom instrumentation for each one quickly becomes difficult.
An even larger challenge is deployment. Installing and maintaining tracing hooks across the coding harnesses used by hundreds or thousands of developers requires coordination, ongoing maintenance, and support for multiple versions of the same tooling. What begins as a straightforward observability solution can become an operational burden at scale.
A more scalable approach is to capture traces in a centralized location without modifying individual harnesses. By placing a proxy between the harness and the model provider, organizations gain a consistent observation point for all model interactions regardless of the framework, model, or provider being used. While a proxy may not have access to every internal runtime decision, it can capture model requests, responses, tool invocation patterns, token consumption, latency, and cost metrics, which are often sufficient for understanding agent behavior and optimizing performance. This makes the proxy a practical and non intrusive solution for organizations looking to deploy agent observability at scale.
Proxy vs Router vs Gateway #
The terms Proxy and Gateway are used interchangeably as a Gateway can include the proxy features as well. However, I would like to keep these separate because in my project, I just needed the Proxy and using a Gateway would have been an overkill.
Gateway: “Is this request allowed, and under what constraints?”
LLM Gateway is the first point of contact for the Agent Harness and is part of the LLM Control Plane. It handles ingress concerns before any costly model routing or inference happens. Authentication, rate limiting, and security guardrails like malicious prompt blocking are some of the features it provides.
Router: “Where should this request go?”
LLM Router is the decision engine and selects the model, provider, region and load balancing across multiple configured endpoints. Cost/performance decides if the request should be sent a cheaper model or a more complex model for reasoning. Fallbacks keep traffic flowing even if one of the providers degrades or throttles the request. Finally, load balancing ensures the traffic is spread across multiple endpoints so no single one becomes a choke point.
Proxy: “How do I communicate with that provider?”
The proxy sits between the router and the model provider and is responsible for handling the mechanics of communication. It performs request and response translation, injects credentials, manages retries, and provides a consistent interface across different model providers. More importantly, because every request and response passes through it, the proxy becomes a natural observation point for capturing traces, measuring token usage, monitoring latency, estimating costs, and analyzing agent behavior without requiring changes to the harness itself.
LiteLLM as Proxy #
LiteLLM can function as both an AI Gateway and a proxy. I used it primarily as a proxy because our goal was observability rather than model governance or traffic management. By placing LiteLLM between the agent and the model provider, we gained a centralized observation point capable of capturing requests, responses, tool activity, token usage, latency, and cost metrics without modifying the agent itself.
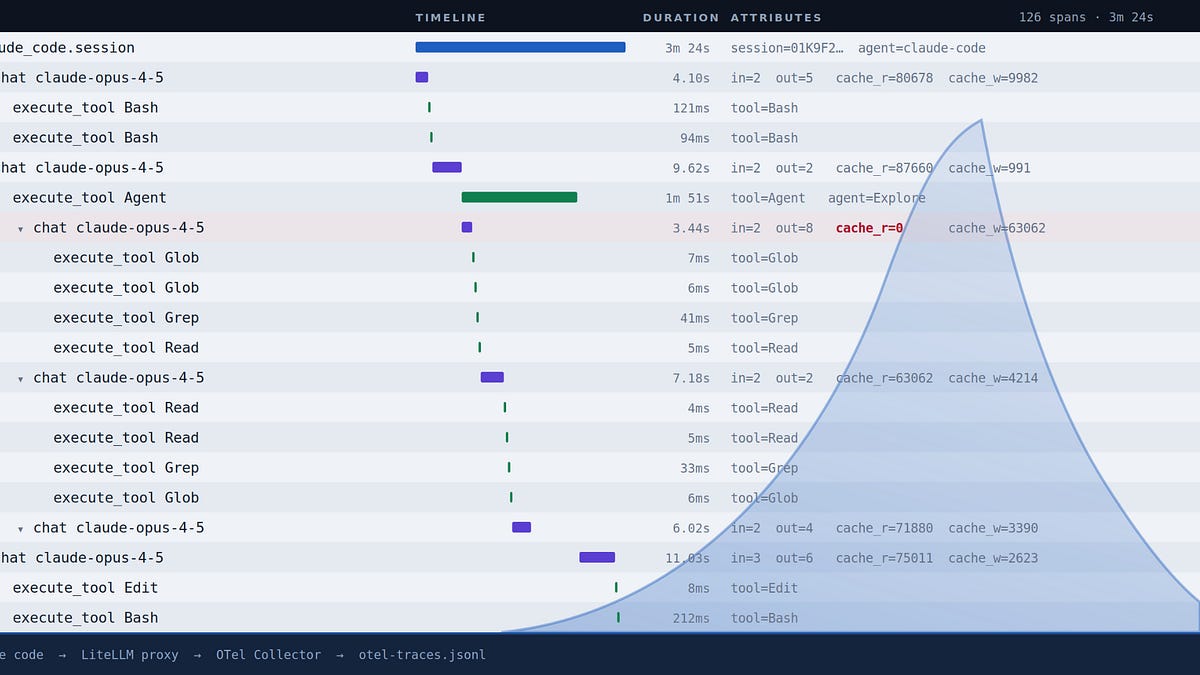
In this verified Claude Code session, the trace captures 126 spans across 3.4 minutes of wall clock time. It precisely records each round with Claude Opus, subagent workflows like Explore, and execution latencies across tools like Bash, Glob, Grep, and Read, while tracking exact cache read and cache write token metrics for every call.
The Data Path: Hop by Hop
- Client (Claude Code / curl): Makes a standard Anthropic Messages API request. By setting ANTHROPIC_BASE_URL=localhost, the request is routed to the proxy instead of going directly to Bedrock.
- Proxy (LiteLLM on port 4000): Receives the request, forwards it to Bedrock using AWS credentials, and returns the response. Because callbacks: [”otel”] is enabled, it generates OpenTelemetry spans containing timing, token counts, model details, and cost metrics.
- Transport (OTLP/HTTP): The proxy uses the OpenTelemetry Protocol (OTLP) to POST these spans over the network to localhost/v1/traces, rather than just printing them to a local console log.
- Collector (otelcol-contrib on port 4318): The OpenTelemetry Collector receives the OTLP spans and processes them through its configured pipeline.
- File Exporter: Configured within the Collector’s pipeline, this component takes the processed telemetry data and appends it directly to a local disk.
- Output (otel-traces-otlp.jsonl): The final destination is a JSON file containing canonical OTLP data, written with one line per exported batch.
Here’s a sample trace:
More importantly, the trace provides the raw data needed to understand where tokens are being spent, how often tools are invoked, and how many model iterations were required to complete a task.
Conclusion #
With conventional software, we instrument the code to understand why a failure happened. With LLMs, we often need to understand why a particular outcome happened at all. LLMs are inherently nondeterministic, and the same input can produce different outputs across runs. There is no stack trace when an answer is incorrect, when the model hallucinates, or when it confidently takes the wrong path. The trace becomes the only reliable record of what actually happened, and analyzing it is essential for building and improving agentic systems.
Docker solved the problem of software that worked on one machine but failed on another by allowing us to package and ship a known working environment. That model does not translate cleanly to LLM applications. Models evolve, prompts change, tools are added or removed, and context varies from one interaction to the next. Even when the application code remains unchanged, the behavior of the system can be very different. Capturing and analyzing traces provides the evidence needed to understand those changes and their impact.
Tokens are expensive, context windows are finite, and every additional turn increases both cost and latency. We need to understand what context is being sent to the model, how many iterations are required to complete a task, which tools are being invoked, and whether those tools are contributing to or hindering the outcome. A trace provides visibility into each step of that process. By capturing and analyzing traces, we can reduce token waste, improve tool selection, shorten execution paths, and build more reliable agentic systems.
In the end, every token spent, every tool invoked, and every decision made by an agent leaves a trail. Follow the trail, and the system becomes understandable. Ignore it, and you are flying blind.