Quick Introduction
We have all been on forums, chats, reddit, discord, youtube, or somewhere and heard “Oh! Model XYZ is AMAZEBALLZ!zomgwtfbbq” then downloaded it (or more likely, some quantized form of it) and said “eww… This sucks!”
This post is going to be a rather technical series of experiments to demonstrate the impact of implementation-specific hazards with inference. I will be using the term “reference implementation” to describe the lab that published and offers first-party hosting of their models and posts original benchmark claims. Their hardware will be different than yours. Their software will be very different than yours. And the comparisons in this post are not going to be running some 2.58-bit-gguf-in-ollama with a couple test prompts.
I am intentionally glossing over entire emerging fields of study, mountains of research papers and lit review to make this more approachable for you the reader. Don’t nit pick my oversimplifications or I will make you read the really long unpleasant version with math.
Your local implementation sucks. But that’s ok, because everyone else’s does too.
Every single instance of hardware and software running an LLM today is a little bit different. or a lot different when it comes to some cases. The average home lab user might be mixing multiple different generations of GPU. The chips on those have different instruction sets. Those instruction sets will implement and execute math to calculate your next token differently from any other person, even when running the same exact weights.
So that begs the first question: How much does your particular setup suck? Turns out there are a number of different ways to go about measuring that.
The practical approach is straight forward. Run standard benchmarks. A variety of them. terminal bench, hle, SWEthis, HELLAthat, MMLU-whatever… take your pick. Just make sure its representative of your actual workload/use case. Do not crank temperature to zero and paste in 3 test prompts then call it good/bad. Zero-shot tests are not a good analog of most agentic tasks. You need long-context tool-calling and domain specific knowledge evaluations to figure out where your setup is weak when running the same weights as somebody else replicating those same benchmarks.
But the purely mathematical answer is where my focus is going to begin because as @wendell said:
Math is Math!
“Logits” are the models scores for each possible next token. They are normalized into probabilities, passed through the configured sampler, and converted back into text by the detokenizer to generate THE→NE→XT→TOK→EN during decode.
A side note about sampler settings: the model card on HF usually specifies exactly what sampler settings (and chat template) you should be using. temp 1.0, top-p 0.95, etc. it varies by model so make sure you are using the right ones. btw, setting temp too low is why your qwen is sitting there looping unable to escape its THINK output. You’re welcome, glad I could fix that for you.
When the next token probability changes enough, THE→NE→XT becomes THE→NE→W→DAY… And while those small changes might be fine, odds are that’s the beginning of the niggling sensation in the back of your mind that something feels off.
Some of you may have heard the term KLD before, or KL Divergence. Don’t worry, I won’t make you do any math or flood your brain with tables of very small decimal numbers. But just in case you wanted the simple version: convert the output logits into a probability distribution, and measure how far that distribution has moved from a chosen baseline. Lower KLD means closer to that baseline, not automatically ‘smarter’. KLD is also directional, so the order of the two distributions matters.
A word of caution: Don’t get suckered in by impossibly low KLD claims on a quant HF model card. It is impossible to interpret a number unless the author discloses the reference checkpoints and full runtime environment, evaluation text, calibration data, context lengths, sampled positions, KL direction, any vocabulary truncation, and how the measurements were aggregated. The methodology matters as much as the number and plenty of people get it wrong.
What the hell is vllm doing?
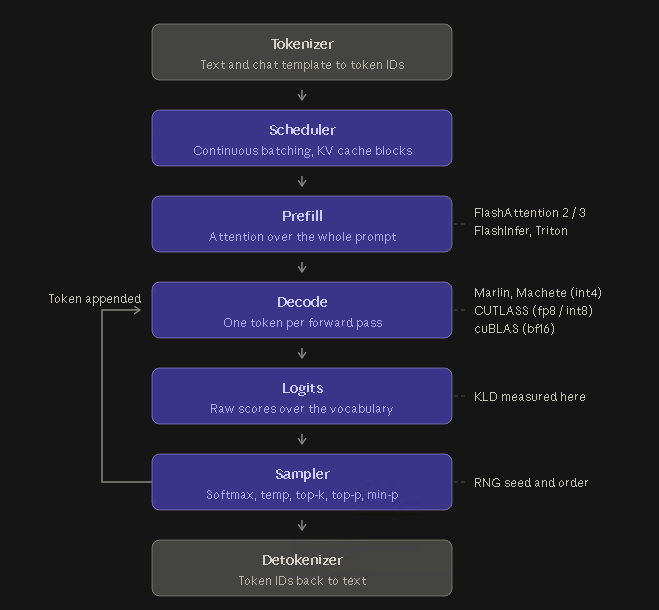
Now, we need to take a brief field trip down what the giant stack of software is doing on your inference engine to understand where some of those sources of divergence come from.
At every step of this oversimplified diagram are components that can be configured or changed based on your specific hardware/software footprint, model, quant, tensor shape, etc.
The nightly VLLM container image I snagged had 734 (252 uv/pip Python) packages in it. That’s 734 codebases each with their own bugs and undocumented idiosyncrasies. The path your specific implementation takes through that mountain of code will be distinct.
Test 1: Precision Benchmarking Attention Backends
Lets start with one piece of that inference flowchart. During prefill (prompt processing) there are a several attention backends your inference engine will select from. This impacts both speed and precision of prefill, while requiring different cuda kernels for every GPU family / SM compute capability 1.3. The CUDA platform — CUDA Programming Guide . Lets test them and compare.
(I’m really very sorry, I had to…) I started with the official BF16 checkpoint of Qwen3.6-27B on an RTX PRO 6000 Blackwell GPU at tensor parallelism 1. The KV cache was BF16, with no weight/activation or KV-cache quantization. The software was a pinned nightly vllm build. I used eager execution, disabled CUDA graphs, prefix caching, and MTP, and used 2k-token chunked prefill.
Qwen3.6-27B is dense, not an MoE, but it is still a hybrid model. 64 layers repeat in a pattern of three Gated DeltaNet/linear-attention layers followed by one full-attention layer. Only those 16 full-attention layers use the selectable attention backend in this experiment; the Gated DeltaNet path remained fixed.
The workload replayed here is “Prompt 2”, a roughly 100k token context captured from a real Turnstone lab workstream containing multiple tool calls and real work products. It was selected to resemble what a local agent actually does rather than a synthetic needle-in-a-haystack test. And maybe more importantly, it doesn’t appear in any benchmark or training dataset in the wild today. Nobody could have benchmaxed for this, or calibrated their quant to accommodate it.
There are three available full attention backends to select from in vllm for this workload: FlashAttention 2, Flash Inference, and Triton Attention. This was the only change made between executions, the rest of the hardware and software stack remained stable.
I also performed a same-backend cross-GPU repeatability control. For this graph, I captured the full-vocabulary logits in BF16 every 32 prompt tokens. Distribution comparisons such as KLD were calculated afterward in FP64 from those stored logits.
Top-1 agreement is whether the token with the highest logit, the greedy argmax, was the same. All three backends were evaluated against the same forced token history. A “top-1 flip” therefore means a backend would have chosen a different greedy next token at that position. We did not let that choice alter the remaining history. This keeps the mathematical comparison controlled, but it does not show how far an unconstrained generation would branch or whether a tool call would eventually fail… that comes in test 2 ;D
The following graph shows % of sampled logits resulting in token flips:
For the first several thousand tokens, every run of the model agreed about what the next token was going to be regardless of backend. Then in later portions of the prompt, backends began disagreeing. Triton was selected as the baseline to simplify upcoming quantization chicanery. Each 8k-token window contains 250 sampled positions, one probe every 32 tokens. The percentage is the fraction of those probes where the other backends highest-scoring token differed from Triton’s.
Random noise was accounted for by running the same test with the same attention backend multiple times. The logits across runs at every hidden state were bit for bit identical. Meaning this particular divergence comes exclusively from the matrix multiplication and addition operations happening during prefill inside trt/fa2/fi.
Disagreements appeared in clusters and varied with prompt content rather than increasing smoothly with context length. This is not evidence of one universal length at which the model “falls apart” but… we will get there soon…
Now that we have a baseline comparison of interesting prompt fuel, lets dive into…
Test 2: KV Cache quantization, or why your LLM’s IQ drops like a rock after 40k tokens
Repeating the same methodology, we took the BF16 weights and BF16 kv cache baseline above running Triton, and ran the next experiment. What happens when you leave the weights and activations alone, and JUST quantize the kv-cache?
Ah, divergence. And this leads us to our first dumpster-fire of the evening: a completely reproducible tool calling error.
Enough top-tokens got flipped during tool calls, we let them play out and while BF16 was fine, int8 kv-cache eventually managed to recover, int4 did not!
Test 3: Weight Weight, Don’t Tell Me!
This time we are leaving all the kv-caches full size at bf16. We are adding some new players to the game however by comparing:
- BF16 reference: Qwen/Qwen3.6-27B (
[Qwen/Qwen3.6-27B · Hugging Face](https://huggingface.co/Qwen/Qwen3.6-27B) )
- Official FP8: Qwen/Qwen3.6-27B-FP8 (
[Qwen/Qwen3.6-27B-FP8 · Hugging Face](https://huggingface.co/Qwen/Qwen3.6-27B-FP8) )
- INT8 W8A16: TheHouseOfTheDude/Qwen3.6-27B-INT8 (
[TheHouseOfTheDude/Qwen3.6-27B-INT8 · Hugging Face](https://huggingface.co/TheHouseOfTheDude/Qwen3.6-27B-INT8) )
- NVIDIA NVFP4: nvidia/Qwen3.6-27B-NVFP4 (
[nvidia/Qwen3.6-27B-NVFP4 · Hugging Face](https://huggingface.co/nvidia/Qwen3.6-27B-NVFP4) )
- AWQ W4A16: cyankiwi/Qwen3.6-27B-AWQ-BF16-INT4 (
[cyankiwi/Qwen3.6-27B-AWQ-BF16-INT4 · Hugging Face](https://huggingface.co/cyankiwi/Qwen3.6-27B-AWQ-BF16-INT4) )
These 4 quants represent a broad picture of weights and activations. A notable piece of information for our mathnasium is the actual CUDA kernel / GEMM (general matrix multiplication) / MMA (matrix multiply accumulate) instructions being run to calculate the logits for each quant are different:
Qwen3.6-27B (reference) Weights/activations: BF16 weights, BF16 activations Linear/GEMM: UnquantizedLinearMethod → torch.nn.functional.linear. Each CUDA tile selected by its associated shape/geometry. KV cache: BF16 (Forced) Qualification: Reference checkpoint.
Qwen3.6-27B-FP8 Weights/activations: E4M3 FP8 weights in 128×128 blocks; dynamic FP8 activation quantization inside converted linears; excluded modules such as lm_head remain BF16 Linear/GEMM: Fp8LinearMethod → CutlassFp8BlockScaledMMKernel KV cache: BF16 (Forced) Qualification: DeepGemm was automatically disabled because vLLM flags its E8M0 scale format as accuracy-degrading for this architecture (SM120); CUTLASS was selected instead. No calibration dataset was identified in the published files.
Qwen3.6-27B-INT8 Weights/activations: Static, symmetric, channel-wise INT8 linear weights; BF16 activations (W8A16). GDN/linear_attn projections and lm_head excluded from quantization. Linear/GEMM: CompressedTensorsWNA16 → MarlinLinearKernel KV cache: BF16 (Forced) Qualification: One-shot quantization with explicitly no calibration dataset. Its unusually good fidelity is less mysterious once you account for W8A16 plus unquantized GDN projections.
Qwen3.6-27B-NVFP4 Weights/activations: Mixed checkpoint — 208 static FP8 W8A8 targets covering 64 full-attention projections and 144 GDN projections; 193 NVFP4 W4A16 targets covering 192 MLP projections plus lm_head, group size 16 Linear/GEMM:
- FP8 targets: ModelOptFp8LinearMethod → FlashInferFP8ScaledMMLinearKernel
- NVFP4 targets: NVFP4 GEMM → MarlinNvFp4LinearKernel
KV cache: BF16 (Forced) Qualification: Not native FP4 arithmetic in our upstream-nightly run. vLLM classified the GPU path as lacking native FP4 support and explicitly selected weight-only FP4 compression through Marlin. The checkpoint’s embedded FP8 KV scheme was overridden with BF16 KV for the bakeoff.
Qwen3.6-27B-AWQ-BF16-INT4 Weights/activations: Static asymmetric INT4 weights, group size 32, MSE observer; BF16 activations (W4A16). GDN/linear_attn projections and lm_head excluded. Linear/GEMM: CompressedTensorsWNA16 → MarlinLinearKernel KV cache: BF16 (Forced) Qualification: AWQ calibration dataset disclosed as “STEM and Agentic.”
Other notable information for this run:
- Full softmax/GQA attention for all models was AttentionBackendEnum.TRITON_ATTN; JIT monitor observed kernel_unified_attention.
- GDN prefill: Triton/FLA GDN prefill kernel, requested as triton, head_k_dim=128.
- During execution, the recurrent path also JIT-compiled _causal_conv1d_update_kernel, fused_recurrent_gated_delta_rule_packed_decode_kernel, and reduce_segments.
- TP1, eager mode, no CUDA graphs, no MTP/speculative decoding, language-only execution.
The next-token flip results shake out fairly predictably. TheDude (W8A16) mops the floor with everybody, beating first party FP8 (W8A8) and Nvidia(FP4-is-a-Lie) release. In fact, out of the 5 options, Nvidia’s release comes in dead last hitting ~50% token flips by the time we reach 88k context.
Both the NVFP4 and AWQ W4A16 failed to properly close their tool calls and botched Cisco command line syntax (the correct command was ‘show arp’, while they executed ‘show run’), while both FP8 and INT8 were able to complete the correct calls.
In future experiments I will try to explore the impact of using different fused GEMMs for the same weights, this is another interesting source of divergence where sometimes you have to trade precision for speed.
Part 1 Wrap Up
I have quite a few more experiments and observations to post, but require a great deal of parallel GPU time to calculate and record every logit sampled across huge context chains on multiple prompts with dozens of different settings.
If you have specific questions, shoot me a DM or poke me on discord I guess.