On October 28, 2026, the White House issued a proclamation under Section 232 of the Trade Expansion Act of 1962. This followed a Commerce Department investigation that concluded imports of robotics and industrial machinery “threaten to impair the national security.” No new tariffs have been set yet. Section 232 opens a 180-day window till April 26, 2027 to negotiate with trading partners.
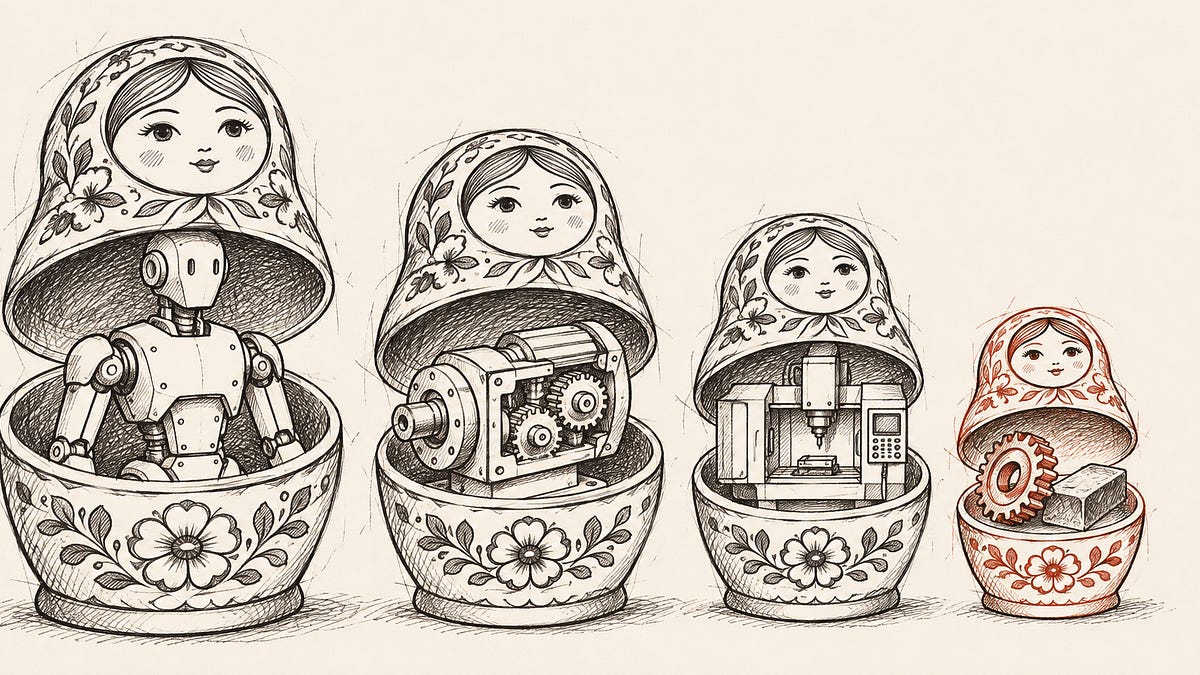
This ties back to one theme that keeps coming back to me as I write on Core Matter. The bottleneck for scaling physical AI sits below the finished machine, in the components inside it, the materials inside those components (eg, rare earth magnets), and the machines that build them (this piece’s topic), as we covered in Part 4 of the actuator series. It’s like a Russian doll, layer after layer.
With the fresh Section 232 news, I went down the rabbit hole of the US machine tool landscape. Here’s what I found.
- The US imports about half of the machine tools it uses , $5.8bn of $11.4bn in 2025. Assuming demand (which is not the trend, see point 3) stays flat, US output would need to grow 63% to 83% ($4.4bn to $5.8bn a year) to replace imports with domestic machines.
- The US builds everyday machines and imports the precise ones. About 55% of import value is the high-end versions of machines US plants already make, such as 5-axis machining centers. Precision machines, small-module gear grinders, precision grinders and the heaviest forging presses have no confirmed US volume builder. Imports rose 29.5% for grinders and 76.7% for gear machines in Jan to Sep 2026. These machines make the ball screws, bearings, gears and forgings that aircraft, turbines and robots depend on.
- Orders are at a record by value since 1998, while a domestic ramp is limited by people and components. US machine tool orders grew 45.0% to $5.76bn in Jan to Sep 2026, after 3 straight years of decline. Aerospace, power generation, munitions and shipbuilding are pulling it up. A domestic ramp is limited by people, castings and imported components (the components that make the machines, the next doll in). We dive into the key cost drivers and where industrial AI could change the cost structure.
This piece also launches our first Core Matter model, a US machine tool demand model built up by end market. It puts US machine tool consumption at $12.7bn to $15.4bn a year on average over the 2026 to 2030 build-out, up from $11.4bn in 2025. Paid subscribers can download the full model, with every input and source, at the end of this piece.
In this piece
- US Machine Tool Imports Are Half of an $11.4bn Market
- Which Machine Tools the US Makes vs. Imports
- Aerospace, Gas Turbines, Munitions and Ships Drove Machine Demand in 2026
- Who Builds Machine Tools in the US, and How Fast Can Supply Ramp?
- Fixed Costs and People Keep New Machine Tool Builders Scarce
- Machine Tool Startups Building the Machines That Build the Machines
- Section 232, the 1986 Machine Tool Precedent and What the 180 Days Decide
1. US Machine Tool Imports Are Half of an $11.4bn Market #
Assuming domestic demand stays flat, which is not the trendline as we’ll discuss in section 3, closing the import gap means $4.4bn to $5.8bn of new US machine output a year, or output up 63% to 83%. The low end replaces net imports, and the high end replaces every imported machine.
In 2025 the US produced $7.0bn of machine tools, consumed $11.4bn, imported $5.8bn and exported $1.4bn, per Gardner’s World Machine Tool Survey.
Forming and stamping ($1.48bn) and machining centers ($1.43bn) are the top 2025 imports. Imports of precision grinders or gear grinders rose rapidly at 29.5% and 76.7% in January to September 2026, against about 9.6% for all machine tool imports. We could not confirm US volume production.
2. Which Machine Tools the US Makes vs. Imports #
The US imports 5-axis machines, horizontals with pallet systems, large gantries and boring mills, precision and gear grinders, and presses. It builds in volume entry and mid-range 3-axis mills and lathes.
“Japanese and DACH (Germany, Austria and Switzerland) machines generally fulfill buyer needs in the higher segment while US and Taiwanese (ROC) generally fulfill them in the lower.”
One distributor analyst put it succinctly in a filing to the Section 232 docket.
What do higher vs. lower segments mean? Higher means more axes, tighter precision, bigger work envelopes and more automation, at a higher price. The average imported machining center cost about $196k in 2024, roughly 2x our estimate of about $96k per machine at Haas, the largest machine tool builder in North America.
See the table below of what these machines do, and who the main buyers are.
While Okuma (Charlotte), Makino (Ohio), United Grinding (Ohio), Kapp Niles (Colorado) and DN Solutions (New Jersey) have large US sites, the sources we found describe them as sales, service or headquarters sites. The largest two import classes feed autos, aerospace and defense. Forming and stamping machines make stampings, shell bodies and aerospace forgings. Machining centers make everything from brackets and housings to aerospace structures and turbine parts. My guess is that a cutoff at the high end would hit aerospace, defense and power first.
The US built its own heavy forging presses in the 1950s. The newest ones came from a German builder. Heavy forging presses squeeze titanium, aluminum and nickel into one-piece parts such as landing gear, airframe bulkheads and turbine discs. Because so few exist, these presses can cap how many aircraft and engine parts get made here.
Robot reducers need ultra-precision gear machines, which are imported and in low volumes. Robot joints use reducers, small gearboxes whose teeth are cut and ground on gear machines. Leaderdrive, a Chinese reducer maker, told the Shanghai stock exchange that a plant for 1 million harmonic reducers a year needs 30 ultra-precision gear machines, at about $833k each.
Assuming 23 reducers per humanoid (on the low end, based on Unitree G1 teardown), 1 million humanoids a year (Tesla’s stated line capacity) would need about 690 of those machines, or about $115mn a year bought over the 5 years to 2030. That is 2.3x and 1.2x all US gear-machine imports, $50.7mn in 2025 and about $100mn a year at the 2026 pace.
I ranked the hardest machines to ramp domestically based on, a) which are whether we found a US builder making them in volume, b) how long new capacity takes, and c) how much it costs. Details are in the Core Matter Industrial Machinery Model.
Machines to build in the US, ranked from hardest to ramp:
- Small-module gear grinders. They finish the gears in robot reducers and aerospace gearboxes. We could not confirm volume production of these at any US builder.
- Precision cylindrical and thread grinders. These grinders make the ball screws and bearings that other machines need. United Grinding, the Swiss grinding group, serves the US from an import and service site in Ohio. We found 2 US builders, Weldon (Pennsylvania) and Drake (Ohio), and could not confirm volume production at either.
- Heavy forging presses. The 2 largest US presses we found built or rebuilt since 2000 came from a German builder. Each project took years and $100mn or more.
- Large gantries and boring mills. Ingersoll and Fives build them here, so these are the likeliest candidates to ramp. The constraint is size and lead time.
- High-end 5-axis machines and automated horizontals. Mazak and DMG MORI already build some in the US, so expansion of existing plants is the shorter path here.
3. Aerospace, Gas Turbines, Munitions and Ships Drove Machine Demand in 2026 #
US machine tool orders have picked up significantly in 2025 and 2026. Order value rose 22.5% to $5.74bn in 2025, and another 45.0% to $5.76bn in January to September 2026. That was after 3 straight years of decline, including a 3.8% fall in 2024. AMT calls the first half of 2026 its strongest half since the series began in 1998.
Who buys these machines in the US?
- Aerospace orders rose 45.1% in 2025, and in the first half of 2026 aerospace ordered more machinery than in any half on record. AMT ties 2026 demand to the space economy, commercial aircraft backlogs and munitions, so commercial demand is part of it alongside defense.
- Power generation orders in the first half of 2026 ran 14% above automotive.
- Contract job shops , AMT’s largest customer group, grew orders 19.1% in 2025.
- Data centers drive gas turbines machinery demands. Klingelnberg says that in the US “the rising energy needs of these data centers are providing additional momentum, for example through investments in gas turbines.”
The US buys $11.4bn of machine tools a year today. Four build-outs (munitions, ships, gas turbines, commercial aerospace) add $1.0bn to $2.9bn a year of extra buying for 5 years, on top of 1% to 3% normal growth. That puts US buying at $12.7bn to $15.4bn a year in 2026 to 2030.
Munitions is the largest piece. The one new US plant we found, Haas Henderson, adds about $0.5bn of machines sold at home. So imports rise from $5.8bn to about $6.9bn to $9.5bn a year, and the import share goes from 51% to 54% to 62%.
4. Who Builds Machine Tools in the US, and How Fast Can Supply Ramp? #
A domestic ramp-up faces four limiting factors.
- Workforce. This is the manufacturing story repeating all over again. Gleason’s executive put it first, saying “First you need a large enough, trained workforce. This needs to be the top priority to expand the industrial base.” Haas is hiring more than 1,000 people for Henderson at starting pay of about $23 an hour.
- Castings. Castings are the heavy iron bed and columns of a machine. Haas bought “more than 100 million pounds of castings each year” back in 2006 and worried that shrinking US foundry numbers “could limit their company’s growth.” At 10,000 to 13,000 machines a year, that is roughly 7,700 to 10,000 pounds (3.5 to 4.5 tonnes, about the weight of 2 to 3 cars) of castings per machine.
- Imported components. The parts inside the machines are imported too, including controls (FANUC, Siemens, Heidenhain, Mitsubishi), spindles, ball screws and linear guides. Tariffs raise their cost, and control deliveries have seen delays.
- In April 2025 Haas asked for “tariff exemptions for raw materials and components vital to the U.S. machine tool industry.” DMG MORI’s 2025 results blame late deliveries partly on “delays in switching to new European-made CNCs.”
- Time. “A shift in global production takes a lot of time,” per GMTA, a US importer of German gear machines. One example is Haas’s plant in Henderson, Nevada. The city closed the land sale in November 2019, with completion planned for 2022. Haas asked the city to extend its deadline, citing the pandemic, supply chains and construction costs. They eventually held the groundbreaking in October 2024. The plant is scheduled to open in Q1 2027, 5 years behind schedule.
Imports are slow to fill a jump in demand too, since foreign builders hold about 7 months of sales in backlog, with DMG MORI at 7.0 months on September 30, 2026 and Klingelnberg at about 7 at the end of March 2026. Klingelnberg’s backlog has halved since 2023.
5. Fixed Costs and People Keep New Machine Tool Builders Scarce #
Would this spur a new generation of startups to build the machines that build the machines? As I read the filings of listed builders, the economics are brutal.
What I took away from these financials is that for European and Japanese builders, people cost about as much as materials. Personnel is 30% to 41% of revenue or operating output and materials 38% to 41%. At Chinese builders, total employee pay is 15% to 19% of revenue (Haitian and Kede, 2025) and materials 50% to 62%. Personnel, depreciation and overhead are fixed costs, so margins swing with the cycle. 2025 was a weak year. In 2023 Hermle earned an operating margin of about 21.8% and DMG MORI 10.0%. Labor productivity in US metalworking machinery “has grown only 0.9% per year over the last 30 years.”
What are the key materials? Neway, a Chinese CNC machine builder (688697.SS)’s IPO prospectus published their bill of materials. Of Rmb840.0mn ($122mn) of purchases in 2020, the split is below.
- Functional components (hydraulics, tool magazines, rotary tables) are 25.6%
- Castings are 22.3%
- Electrical parts (mainly the control) are 20.9%. The control alone is about 17.7% of purchases.
- Transmission parts (spindles, guides, screws, bearings, gears) are 15.4%
- Accessories, machined parts, sheet metal and other are 15.8%
Control and distribution are two levers that can help expand margins.
- The control. A CNC control is the machine’s computer, software, servo drives and motors. Most builders we checked buy it from FANUC, Siemens, Heidenhain or Mitsubishi, and FANUC earns a 21.4% operating margin (company-wide) against 3% to 10% at most builders we checked.
- Cutting the middlemen. US distribution typically has 2 levels, “a wholesaler and a dealer,” and “each level marks their cost up as much as 20%.”
6. Machine Tool Startups Building the Machines That Build the Machines #
Could venture capital close the machinery gap with the next wave of startups? I went searching and found no venture-backed US company building production machining centers, grinders or gear machines. (If you are building them, I’d love to hear from you!)
What we can learn from history. Haas, the largest machine builder in North America, was founded in 1983, during the import surge behind the 1983 machine tool Section 232 petition. It started with indexers and built its first vertical machining center in 1987. Today it builds about 10,000 to 15,000 machines a year on about $1.2bn of revenue, and is private.
The small US builders popped up in the 2000s. They include Tormach (Wisconsin, 2001), Pocket NC, now Penta Machine (Montana, 2011), and Langmuir Systems, a plasma-table maker bought by ShopSabre in 2023. They design and sell desktop and small-shop machines.
US venture money has gone to companies that use machine tools or build equipment for their own factories. Examples include Hadrian, Machina Labs, Divergent, VulcanForms, Freeform and Seurat. Hadrian’s new Alabama factory is the first of three supported by a $900mn Navy contract, with a goal to “automate 80% of the work.”
This year’s capital went to factory software and sensing. Arda, led by OpenAI’s former research chief Bob McGrew, came out of stealth in October 2026 with $232mn of funding, its Series A at a $1.5bn valuation, building AI that turns product designs into assembly lines. Matter, whose cofounder and CEO Adi Prasad came from Tesla, offers final assembly, test and packaging for robots in the US. In machining software, CloudNC raised $20mn (UK, September 2026, with Lockheed’s venture arm), Limitless Labs $20mn (Israel) and IPercept $16.5mn (Sweden, entering the US).
Funded machine builders abroad tell a different story. Ethereal Machines (India) raised a $28.5mn Series B in 2026. It builds its own multi-axis CNC machines, sells machining as a service from them, and is building its own controller and a 300,000 sq ft plant. Shanghai Xinghe (China) builds gear grinders and raised several hundred million yuan in July 2026.
Government money has gone to training and adjacent supply. America’s Cutting Edge, a national CNC machining training initiative backed by Oak Ridge National Laboratory (ORNL), received $42mn from the Defense Department from 2020 to 2022 for machine tool training and R&D. The Pentagon’s industrial base program has awarded over $3.3bn since FY2024. The releases we read do not name any machine tool builder.
With Section 232, I believe two opportunities arise domestically in the US.
- Foreign builders establish US bases to build machines. They are more experienced in navigating thin margins, but that would likely still require government incentives to boost investments.
- Startups in the same spirit as Ethereal Machines launch in the US. They would need to think carefully about how to cut labor cost, solve the materials supply chain bottleneck, and build the control in-house from day one.
7. Section 232, the 1986 Machine Tool Precedent and What the 180 Days Decide #
This Section 232 has until April 26, 2027 for its first negotiation update. Section 232 last came for machine tools in 1983, 43 years ago. Will history repeat or rhyme?
The US lost its lead in the 1970s and 1980s. Japanese machine tool exports to the US rose over 1,200% between 1964 and 1967, and by 1986 imports were 75% of the numerically controlled (NC) machines sold in the US, the category that includes today’s CNC machines. Across all machine tools, imports went from about 10% of US consumption in the mid-1970s to 25% by 1981 and about 50% by 1986.
- March 1983. The builders’ association petitions for import quotas under Section 232.
- May 20, 1986. Reagan chooses negotiation. “Voluntary restraint agreements will be sought with Taiwan, West Germany, Japan, and Switzerland.”
- Dec 16, 1986. Japan and Taiwan agree to 5 years of restraint from January 1987. The White House projects up to 16,500 more domestic machine sales over the 5 years and cites industry estimates of about $115mn of new plant investment. The full outcome is hard to score. One NBER study found US output rose from 41,992 machines in 1987 to 48,668 in 1988.
- By Oct 1991. Reports said “at least 10 Japanese machine-toolmakers have established plants in the U.S.”
- Dec 1991. Bush keeps the restraints on computer-controlled machines for a 2-year phase-out from January 1992. Japan’s extension ran to Dec 31, 1993, so 5 years became 7.
- Effects. The US International Trade Commission estimated that in 1987, the first year, the restraints raised prices 4.4% to 4.9% and protected 658 to 671 jobs. AMT says the domestic share held near 50% for the next decade, so the restraints stopped the fall without reversing it. Imports are about 51% of consumption today.
Here is our view.
- A tariff alone raises prices, but buyers keep importing the precise machines. Back in 1987, during the last Section 232, the domestic share held near 50% for the following decade. Fast forward to today, imports are 51% of consumption. One can argue that without the 1987 restraints, the domestic share would be even lower today. This time, imports fell where US plants offer an alternative and kept rising where buyers have few US options. So either the buyers are not price sensitive, or the cost are passed down to the customers. In January to September 2026, with duties in place, machining-center imports fell 3.7% while orders rose 45.0%, and grinder imports rose 29.5% and gear machine imports +76.7%.
- For reindustrialization startups, the openings are in the control and in automation that cuts labor cost. The control is where the profit sits. Builders buy it from suppliers such as FANUC, Siemens, Heidenhain and Mitsubishi, and FANUC earns a 21.4% operating margin (company-wide) against 3% to 10% at most builders we checked. Automation goes after the other big cost. On our numbers, personnel is 30% to 41% of revenue or operating output at European and Japanese builders, about as much as materials. Service margins come from machines already in the field, so they follow once the core machine business is running. This in my opinion is an opportunity for agentic robotics, manufacturing AI founders to shine.
For paid subscribers, check out our first industry model on the projections on industry machinery from 2025-2031 demand below.