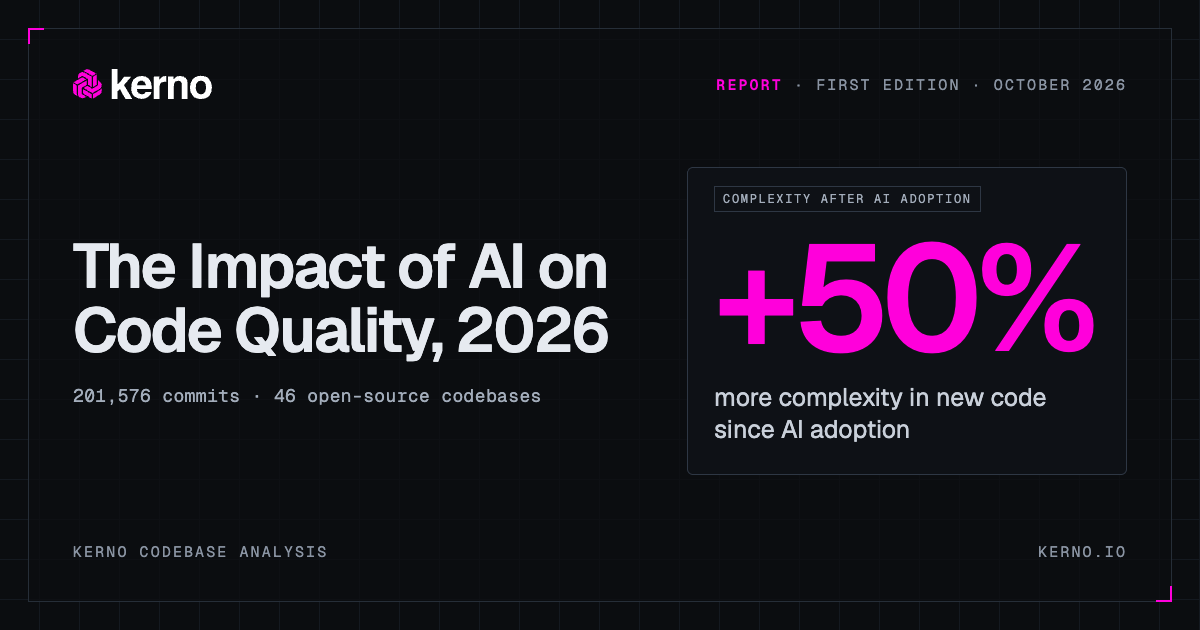
AI is helping developers ship more code, but it is also accelerating complexity that compounds fast. Left unchecked, that complexity will build up silently, in code that is becoming slower and riskier to change.
Ask AI about this report
DWG R-03 Kerno resources · report
- Commits
- 201,576
- Codebases
- 46
- Authors
- 6,847
- Lines of code
- 16M+
Key takeaways #
- 01+50%decision points per 100 new lines### New code is denser.Since AI adoption, every 100 new lines carry 8.1 decision points (
ifstatements, loops and similar), up from 5.2. That is 50% more paths to understand and test. - 02+71%production code per engineer### Each engineer ships 71% more code.In the median codebase, each engineer now writes 424 production lines a week, up from 293. The 71% is the median of each codebase's own change; the change between those two medians is 45%. Team size hasn't changed in any consistent way.
- 03+43%follow-ups on AI-marked commits### Less code is thrown away, but AI commits are revisited more.The share of new code rewritten within 90 days fell from 18% to 12%. AI-marked commits are revisited 43% more often than other commits and are 17% more likely to add a hard-to-test function.
- 048.3%of commits change tests, up from 4.7%### More testing hasn't reduced bug fixes.Test commits rose from 4.7% to 8.3% of all commits, but bug fixes still make up a quarter. One possible reason, which the data can't confirm, is that testing has kept up with the volume of code and fallen behind its complexity.
- 0510.3decision points per 100 new lines in October 2026, from about 5### Complexity was flat until 2025, then rose.It held near 5 decision points per 100 lines from 2022 through 2024 and reached about 10 by October 2026. Codebases where AI use isn't marked also rose, but codebases that adopted AI rose faster.
- 0669%of AI-marked commits signed by Claude### Claude-marked commits are bigger.Claude signs 69% of AI-marked commits, largely because Claude Code marks commits by default and most other tools don't. In the same codebases, Claude's commits are 54% larger than unmarked ones and are revisited 55% more often.
- 07+42%decision points per 100 new lines by late 2028, on the current trend### Complexity keeps rising.On the current trend, new code will carry 42% more decision points by late 2028, rising from 9.0 to 12.8 per 100 lines. If growth keeps compounding at 3.5% a month, the increase would be 128%, to 20 per 100 lines. Every extra branch is another path to reason through, test and maintain.
Since AI arrived, new code carries more complexity, and it's compounding faster #
This is the first edition of The Impact of AI on Code Quality, Kerno's study of how AI is changing the code teams ship. In under two years, AI coding assistants and agents have gone from experiment to the default way much software is written. To see what this means for the codebases themselves, we analyzed 201,576 commits across 46 open-source projects between October 2024 and October 2026, and traced complexity back to October 2022.
New code got denser, and its complexity grows faster each month.
- 8.1Decision points per 100 new lines, up from 5.2. About 50% more paths to understand and test, in pull requests that are already larger than before
- −0.4%Monthly change in complexity from 2022 to 2024, when it was flat and even eased slightly
- +3.1%Monthly growth in the complexity of new code since January 2025, or about 44% a year
- +14%Excess complexity across whole codebases after AI adoption. The build-up is slower, but still real
Most teams won't see this, because the industry measures delivery, not structure. DORA metrics track how fast teams ship, not how each change reshapes the codebase. That gap was manageable when engineers understood all the code they shipped. With agents writing more of it, we expect the problem to stay hidden until it shows up as incidents and stalled features.
Since AI adoption, new code carries 50% more decision points per 100 lines, and complexity growth has gone from −0.4% to +3.1% a month #
A decision point is any place where code can take one of two paths, such as an if, a loop or a case in a switch (McCabe, 1976). Each one is another path an engineer has to understand and a test has to cover.
The rise is recent. From October 2022 to December 2024, complexity held steady at about 5 decision points per 100 new lines. From January 2025 it began to climb, slowly at first and then sharply in 2026, reaching 10.3 in October 2026 (Exhibit 1). The median across all codebases grew about 3.5% a month. The typical codebase's own growth was 3.1%, the figure in this section's heading (Appendix C).
Complexity held near 5 for two years, then climbed to about 10
Decision points per 100 new lines, median codebase each month, October 2022 to October 2026
Median codebase, through 2024From 2025Middle half of codebasesAbout 4.8 in a typical 2023–24 month
| Decision points per 100 new lines, median codebase each month, October 2022 to October 2026 | |||
|---|---|---|---|
| Month | Median | Middle half | Codebases |
| --- | --- | --- | --- |
| October 2022 | 5.7 | 4.46 to 7.4 | 29 |
| November 2022 | 5.57 | 2.4 to 6.52 | 31 |
| December 2022 | 4.38 | 2.82 to 6.39 | 36 |
| January 2023 | 5.19 | 3.76 to 7.12 | 35 |
| February 2023 | 3.96 | 2.62 to 5.96 | 39 |
| March 2023 | 4.9 | 3.48 to 6.43 | 35 |
| April 2023 | 5.3 | 3.45 to 7.15 | 41 |
| May 2023 | 4.86 | 3.62 to 7.62 | 35 |
| June 2023 | 4.44 | 3.16 to 6.88 | 39 |
| July 2023 | 4.52 | 3.01 to 5.81 | 38 |
| August 2023 | 5.85 | 4 to 7.32 | 38 |
| September 2023 | 4.72 | 3.46 to 6 | 37 |
| October 2023 | 4.73 | 2.65 to 6.58 | 39 |
| November 2023 | 4.12 | 3.37 to 6.63 | 37 |
| December 2023 | 4.53 | 2.92 to 6.86 | 39 |
| January 2024 | 5.21 | 3.14 to 6.08 | 36 |
| February 2024 | 4.34 | 3.46 to 5.83 | 37 |
| March 2024 | 4.29 | 2.33 to 6.38 | 38 |
| April 2024 | 5.11 | 3.52 to 6.99 | 38 |
| May 2024 | 3.98 | 1.59 to 5.34 | 40 |
| June 2024 | 4.63 | 3.19 to 7.88 | 39 |
| July 2024 | 5.22 | 3.23 to 7.16 | 39 |
| August 2024 | 5.3 | 3.62 to 6.27 | 35 |
| September 2024 | 4.88 | 3.58 to 7.47 | 37 |
| October 2024 | 5.76 | 3.32 to 6.98 | 38 |
| November 2024 | 4.64 | 3.52 to 6.51 | 36 |
| December 2024 | 5.03 | 2.6 to 6.93 | 30 |
| January 2025 | 4.51 | 2.82 to 5.77 | 36 |
| February 2025 | 4.9 | 3.03 to 6.68 | 38 |
| March 2025 | 5.81 | 3.86 to 6.34 | 36 |
| April 2025 | 4.8 | 3.49 to 7.32 | 37 |
| May 2025 | 5.51 | 3.95 to 6.61 | 36 |
| June 2025 | 5.58 | 3.5 to 7.23 | 36 |
| July 2025 | 5.65 | 4.05 to 7.18 | 39 |
| August 2025 | 5.4 | 3.92 to 6.96 | 35 |
| September 2025 | 5.98 | 3.76 to 8.82 | 36 |
| October 2025 | 5.73 | 4.27 to 8.39 | 37 |
| November 2025 | 5.92 | 4.95 to 7.38 | 36 |
| December 2025 | 5.93 | 4.12 to 7 | 36 |
| January 2026 | 6.34 | 4.7 to 8.43 | 37 |
| February 2026 | 6.42 | 4.02 to 8.85 | 36 |
| March 2026 | 7.95 | 4.97 to 9.31 | 36 |
| April 2026 | 7.91 | 6.46 to 9.33 | 35 |
| May 2026 | 8.42 | 6.43 to 9.41 | 35 |
| June 2026 | 8.12 | 5.66 to 10.52 | 38 |
| July 2026 | 7.43 | 5.72 to 9.83 | 38 |
| August 2026 | 9.17 | 5.86 to 9.8 | 38 |
| September 2026 | 9.85 | 7.22 to 10.97 | 39 |
| October 2026 | 10.31 | 7.26 to 12.42 | 36 |
The rise is just as clear when we measure it around each codebase's own adoption date. Before adoption, the typical codebase added 5.2 decision points per 100 new lines. After adoption, it added 8.1. The rise appeared in 27 of 30 codebases.
It also shows up in the functions that are hardest to work with, those with more than 10 decision points, where testing every path becomes impractical (Exhibit 2).
25 of 30 codebases now add more hard-to-test functions per 1,000 new lines
Functions with more than 10 decision points added per 1,000 new production lines, before vs after AI adoption
Rose: 25 Fell: 5 Median codebase
| Functions with more than 10 decision points added per 1,000 new production lines, before vs after AI adoption | ||
|---|---|---|
| Codebase | Before | After |
| --- | --- | --- |
| activepieces | 1.22 | 1.13 |
| actual | 0.65 | 1.44 |
| appsmith | 0.52 | 1.72 |
| cal.com | 0.61 | 0.77 |
| directus | 1.24 | 2.2 |
| django-cms | 1.37 | 1.71 |
| flagsmith | 0.34 | 0.59 |
| formbricks | 0.79 | 1.14 |
| grafana | 0.69 | 0.93 |
| hoppscotch | 0.9 | 2.03 |
| infisical | 1.13 | 1.09 |
| keep | 1.05 | 1.89 |
| lightdash | 0.9 | 1.43 |
| mattermost | 0.94 | 1.18 |
| n8n | 0.78 | 1.4 |
| nango | 1.52 | 1.51 |
| novu | 0.56 | 1.01 |
| outline | 0.84 | 1.14 |
| payload | 1.41 | 1.64 |
| plane | 0.39 | 0.93 |
| prefect | 0.58 | 1.33 |
| rallly | 0.17 | 0.7 |
| redash | 0.73 | 0.54 |
| sentry | 1.13 | 1.57 |
| strapi | 1.52 | 1.11 |
| twenty | 0.58 | 0.65 |
| typebot.io | 0.83 | 1.61 |
| unleash | 0.45 | 0.5 |
| vendure | 1.1 | 1.27 |
| zulip | 1.26 | 1.4 |
This hard-to-change code is also building up across each codebase as a whole. We graded every codebase from A to D by its excess complexity, meaning the decision points its overly complex functions carry beyond 10, per 1,000 lines. We split the 39 codebases into quarters by this score at the start of the period, with A the lowest and D the highest, then graded them again at the end using the same cut-offs (Exhibit 3).
Complexity began rising in 2025 across the board, including in unmarked codebases, but it rose faster where AI use is marked #
We looked for a trend that appears only after AI adoption and didn't find one. Rising complexity, more code and more testing all appear in codebases where AI use isn't marked (unmarked codebases, from here on). These codebases have few AI-marked commits, but 9 of the 10 in Exhibit 4 have some (12 to 54 each), so AI is present in them. How much AI use goes unmarked can't be measured. This means they are not an AI-free comparison group. Their rise doesn't count against an AI effect, but it can't confirm one either. In codebases that did adopt AI, all three trends ran faster after adoption (Exhibit 4).
The rise follows the calendar rather than each codebase's adoption date. If adoption caused it, the gap would peak at each codebase's own adoption date and fade at other dates. Instead, it appears at all 20 dates we tested (Exhibit 5). That fits an industry-wide shift starting in 2025, including AI use that isn't marked in commits. Within the same codebases after adoption, AI-marked code wasn't clearly more complex per line than other code. AI-marked commits were, however, more likely to add a hard-to-test function, because they were bigger (Exhibit 8).
Wherever the split date falls, more codebases become more complex than less complex
Codebases whose complexity per 100 new lines rose or fell when the same split date is applied to every codebase
- More complex after the date
- Less complex after the date
Split date applied to every codebase
| Codebases whose complexity per 100 new lines rose or fell when the same split date is applied to every codebase | ||
|---|---|---|
| Split date | More complex | Less complex |
| --- | --- | --- |
| Dec 24 | 1 | 0 |
| Jan 25 | 4 | 1 |
| Feb 25 | 5 | 1 |
| Mar 25 | 8 | 3 |
| Apr 25 | 9 | 3 |
| May 25 | 10 | 3 |
| Jun 25 | 12 | 2 |
| Jul 25 | 18 | 2 |
| Aug 25 | 20 | 4 |
| Sep 25 | 24 | 4 |
| Oct 25 | 27 | 3 |
| Nov 25 | 32 | 4 |
| Dec 25 | 33 | 1 |
| Jan 26 | 35 | 2 |
| Feb 26 | 35 | 0 |
| Mar 26 | 34 | 0 |
| Apr 26 | 32 | 1 |
| May 26 | 31 | 1 |
| Jun 26 | 31 | 1 |
| Jul 26 | 30 | 1 |
After AI adoption, each engineer ships 71% more production code a week, with no clear change in team size #
The extra code isn't just churn. Counting only lines still in place 90 days later, output per engineer rose 75%. Commits also got bigger, and very large commits became more common. Over the two years, the typical codebase grew 40%, from 230,000 to 350,000 lines of production code (Exhibit 6).
More code per person means more code for each reviewer to read and for each engineer to own.
Less new code is rewritten after AI adoption, but AI-marked commits are revisited 43% more often than other commits #
This section uses two measures, and neither is a bug count.
- Rework is new code that is rewritten or deleted within 90 days.
- A follow-up is any later commit that touches the same code. A follow-up can be a repair (it fixes the earlier change), an extension (it builds on it) or unrelated. So a follow-up is not the same as rework, and only some follow-ups are repairs.
After AI adoption, rework fell in 24 of 30 codebases. The decline holds in the codebases with the fewest recent commits, whose code had the most time to be rewritten (Appendix C). The number of follow-ups per change didn't clearly change, but fewer of them were repairs (Exhibit 7).
In the same codebases, AI-marked commits are revisited 43% more often than other commits and are 17% more likely to add a function with more than 10 decision points. This held in 21 of 26 codebases. When commits of the same size are compared, the gap disappears, and AI-marked code isn't clearly more complex per line than other code (Exhibit 8).
AI-marked commits also land where code changes most. They made up 9% of all commits but 20% of the edits to each codebase's most-edited functions, a pattern that held in 24 of 30 codebases. Part of the reason is size, since bigger commits touch more functions.
Denser code hasn't yet led to more fixes. Commits that added more decision points per line were no more likely to be fixed within 90 days than commits of the same size that added fewer (+3%, range −8% to +23%, 32 codebases; not statistically clear). Earlier research links complexity to failures over longer periods (Nagappan et al., 2006), which a two-year window can't yet test.
Test changes rose from 4.7% to 8.3% of commits, while bug fixes held at a quarter of commits, as they did before AI adoption #
Test commits per engineer rose in 29 of 30 codebases. Each engineer made more than twice as many test commits a week as before, 0.33, up from 0.15. Measured as test commits per 1,000 new lines, however, testing grew only about as fast as the code. The data has no test line counts or coverage.
Bug fixes stayed at about one commit in four. Because each engineer commits more often, bug-fix commits per engineer rose from 0.58 to 0.70 a week, although this rise isn't statistically clear. Reverts, where a change is undone, stayed rare at under 0.5% of commits (Exhibit 9).
Claude signs 69% of AI-marked commits, which are 54% bigger than unmarked commits, though newer Claude models make smaller ones #
We compared each tool's commits with unmarked commits in the same codebase and the same months. Only Claude appears in enough codebases to give a clear answer. Its commits are bigger, more often very large and revisited more often, but they are not clearly denser per line (Exhibit 11).
Claude Code also records which model wrote each commit. In the 13 codebases that used both, Opus 5 commits were 26% less likely than Opus 4 commits to add a function with more than 10 decision points (lower in 10 of 12 codebases) and 28% less likely to exceed 500 lines (lower in 11 of 13). Lines per commit and follow-ups also fell, but not clearly, and branching per line didn't clearly change. Because Opus 5 is newer, teams may also have learned to scope changes better in the meantime, and the data can't separate the two effects.
Where this is heading #
On the current trend, complexity per 100 new lines rises another 42% by late 2028.
Complexity rarely breaks anything on the day it is written. It slows down the next change, and the one after that. It is felt when something forces a broad change, such as a security patch across many services, a framework upgrade or an incident in code that few people fully understand.
These projections are conservative. They assume complexity grows by a fixed amount each month. In practice, the median across all codebases has compounded at 3.5% a month since January 2025 (Exhibit 1), and each codebase's own growth after adoption was similar. If that pace held, complexity per 100 new lines would more than double in two years, well above even the faster-adoption line (Exhibit 12).
The faster-adoption scenario uses the 20 codebases with the highest share of AI-marked commits. The quality-controls scenario is illustrative. It uses the 10 codebases with the flattest trends, and no quality intervention was observed.
What engineering teams can do #
- 01### Track decision points per 100 lines alongside DORA metricsComplexity rises before delivery metrics move. EffortLowMost static-analysis tools already report it, or Kerno's free scanner can
- 02### Check AI-written code against the running system as it is writtenAI-marked commits are revisited 43% more often. EffortMediumTooling and pipeline changes
- 03### Set a size limit for AI-assisted changesCommits got 63% bigger, and AI-marked commits are a further 42% bigger. EffortLowA team policy and a pipeline check
- 04EffortLowGiven 8 or more months of history
- 05### Mark AI-assisted commitsOnly 9% of commits are marked in the typical codebase, so AI use is undercounted. EffortLowA tool setting
About the research #
We ran Kerno's Codebase Analysis tool on the full commit history of 46 well-known open-source codebases, from October 2024 to October 2026, with a second pass on complexity going back to October 2022. Most are commercial open-core products, and 35 are written mainly in TypeScript, so the results describe that kind of codebase. We chose the 46 by hand based on their size and popularity, so they are not a random sample of open-source projects. The data and analysis scripts behind every number in this report are public at github.com/kernoio/kerno-impact-ai.
How we identified AI use. A commit counts as AI-written only when it carries an agent's mark, meaning an agent in the author field, a co-author line, or a "generated with" note. A codebase's adoption date is the month AI-marked commits pass 25% of the total, or step up and stay up. Most tools don't mark commits by default, so AI use is undercounted.
How we compared. Each codebase is compared with itself, before and after its own adoption date, and counts once. We report the median codebase. We call a result a finding only when it holds across most codebases and is statistically clear, and we say so when it isn't. We tested 16 before-and-after metrics (Appendix B) without correcting for multiple comparisons, so at this threshold about one of them could pass by chance. Percent changes are the median of each codebase's own change, so they can differ from the change between the two medians shown.
What the data can't show. This is observational data. "After adoption" means after the adoption date, not "because of AI". The data has no information on incidents, defects, test coverage or pull-request lead times.
- Commits
- 201,576
- Authors
- 6,847
- Codebases
- 46 (30 with an AI adoption date, 16 without)
- Window
- October 2024 to October 2026
Benchmark your codebase against this report #
Measure your own repository the same way as the 46 codebases in this report, before and after your team adopted AI coding agents.
npm install -g @kerno/clikerno audit
Run both from a checkout of your repository. Needs Node 18 or later.
Learn more about Kerno Audit →
Appendix #
A. Definitions #
| Term | Plain meaning | How it's measured |
|---|---|---|
| Decision point | A place where code can go two ways ( if ,else if , loop,case ,&& ,|| ) |
Cyclomatic complexity (McCabe, 1976), decision points + 1 per function. In TypeScript and JavaScript, ternaries (?:), ?? and catch also count; optional chaining (?.) does not |
| Decision points per 100 lines | How much branching new code brings, independent of commit size | Decision points a commit adds ÷ production lines it adds × 100, summed over each period |
| Excess complexity | Branching in functions too complex to test easily | For each function above 10 decision points, the amount above 10, per 1,000 lines of the whole codebase |
| Maintainability grade | A to D rating of excess complexity | Quarters of the 39 codebases with a trend at the start (cut-offs 4.1, 7.2, 9.6); same cut-offs at the end |
| Rework | New code rewritten or deleted soon after it's written | Share of lines from sampled commits changed within 30 or 90 days |
| Follow-up | Any later commit that comes back to the same code | Count of later commits touching a change's lines, per change |
| Repair | A follow-up that fixes the earlier change | Judged by an AI model; verdicts below 0.5 confidence dropped |
| Extension | A follow-up that builds on the earlier change | Same as repair |
| Reimplementation | A new function that duplicates one the codebase already had | Matched by name, then logic; judged by an AI model |
| Engineer-week | One person with at least one commit in a given week | Bots excluded |
| Commit type | Bug fix, test change, revert, feature | Read from the commit's subject line; 70% to 88% accurate on 100 checked by hand |
B. Every metric, before vs after AI adoption #
| Metric | Median change | 95% range | Rose / fell (of 30) | Clear? |
|---|---|---|---|---|
| Decision points per 100 new lines | +51.5% | +32% to +72% | 27 / 2 | Yes |
| Excess complexity per 1,000 lines | +14% | +2% to +27% | 24 / 6 | Yes |
| Functions over 10 decision points added per 1,000 lines | +38% | +21% to +78% | 25 / 5 | Yes |
| Share of commits adding a function over 10 decision points | +62% | +45% to +90% | 25 / 5 | Yes |
| Lines per commit | +63% | +40% to +98% | 26 / 2 | Yes |
| Share of commits over 500 production lines | +34% | +8% to +79% | 23 / 7 | Yes |
| Production lines per engineer-week | +71% | +26% to +116% | 23 / 7 | Yes |
| Active contributors per week | +10% | −19% to +28% | 16 / 14 | No |
| Lines rewritten within 30 days | −16% | −32% to −6% | 8 / 22 | Yes |
| Lines rewritten within 90 days | −26.5% | −34% to −20% | 5 / 24 | Yes |
| Follow-ups per change | +7.5% | −5% to +41% | 18 / 12 | No |
| Share of follow-ups that are repairs | −23% | −40% to −7% | 7 / 21 | Yes |
| Reimplementations per 1,000 lines | −26.5% | −40% to −3% | 7 / 23 | Yes |
| Share of commits that are bug fixes | −4% | −16% to +6% | 13 / 17 | No |
| Share of commits that change tests | +81% | +41% to +127% | 25 / 5 | Yes |
| Share of commits that are reverts | −50% | −61% to −21% | 6 / 17 | Yes |
"Clear" means the 95% range excludes zero and a sign test gives p ≤ 0.05. Percent changes are calculated as described under How we compared.
C. Method notes #
- Monthly growth rates come from a straight line fitted to the logarithm of each codebase's monthly values. Months with fewer than 1,000 production lines are left out.
- The step-up in complexity growth, from +0.7% to +3.5% a month, is not statistically clear on the two-year data alone (range −2.1 to +5.8 points). The four-year re-run makes it clear. In each codebase, growth went from −0.4% a month (October 2022 to September 2024) to +3.1% (January 2025 to October 2026), a step of +3.3 points (95% range +1.7 to +5.3), faster in 31 of 39 codebases (p < 0.001). The 3.5% a month used in the forecast is the growth of the median across all codebases since January 2025, while 3.1% is the median of each codebase's own growth.
- Four-year re-run. The same 46 codebases from October 2022 to October 2026, complexity and attribution only, with adoption months fixed from the main run. Monthly medians leave out months under 1,000 production lines. The main before-and-after result reproduces, at 5.2 to 8.2 decision points per 100 lines, up in 28 of 30 codebases. Leaving out any one codebase moves the October 2026 median by at most 0.03; leaving out the three biggest risers (Vendure, Strapi, Directus) lowers it from 10.3 to 9.7.
- Fixed set of codebases. On the two-year data, the 24 codebases present in at least 20 of 24 months grew 3.1% a month from January 2025, compared with 3.2% for all codebases. The 3.5% quoted elsewhere comes from the four-year re-run, a separate run with slightly different monthly values.
- Recent commits and 90-day measures. In the median codebase, 42% of after-adoption commits fall in the window's final 90 days, so they had less time to be rewritten. In the 14 codebases where under 40% were that recent, 90-day rework still fell 29% (12 of 14, p = 0.01). Lines still in place after 90 days have the same exposure and were not re-run.
- Moving the date. We applied one adoption date to every codebase, for each month from December 2024 to July 2026. More codebases got more complex than less complex at all 20 dates.
- Forecast. Today's median level (9.0) plus each scenario's median monthly slope, projected 12 and 24 months. The range is a 95% bootstrap interval for the median slope. Straight lines from 8 to 30 monthly points are a weak method, so read the ranges more than the lines. The straight line is deliberately conservative. Compounding at the after-adoption rate of 3.5% a month (1.035²⁴ ≈ 2.3×) would give a far steeper rise, but that rate rests on about a year of data per codebase.
- By tool and model. Each tool's or model's commits are compared with unmarked commits in the same codebase and the same months; codebases need at least 20 commits in each group. Follow-ups are counted within 30 days, and commits from the last 30 days are left out. Model names come from the Claude Code co-author line; other tools don't record one. Opus 4 vs Opus 5 compares each against its own human baseline in the 13 codebases that used both. Two engineers named Devin, at Prefect and Mattermost, were counted as the Devin agent by the detection rule; their roughly 350 commits are excluded.
- Data quality. Bots (7% of commits) are excluded from complexity and output measures. Lockfiles and vendored code are excluded too; generated code is 0.1% of file changes. Vue, Handlebars and ERB aren't parsed; 8 codebases have under 90% parser coverage (lowest 58%).
D. Raw data and references #
Every codebase's numbers, the raw benchmark output and the analysis scripts are at github.com/kernoio/kerno-impact-ai.
- Nagappan, N., Ball, T., Zeller, A. (2006). Mining metrics to predict component failures. ICSE 2006
- McCabe, T. J. (1976). A Complexity Measure. IEEE Transactions on Software Engineering, SE-2(4)