Abstract #
When and how different brain regions diversify from one another remains unresolved. Does a common neural ectoderm progenitor generate the entire brain? Or do multiple neural ectoderm progenitors exist, each restricted to form specific brain regions? Here our lineage tracing studies of mouse embryos support the latter model. Two parallel brain progenitors emerge simultaneously during gastrulation: anterior neural ectoderm (forebrain/midbrain progenitor) and posterior neural ectoderm (hindbrain progenitor). Differentiation of human pluripotent stem cells into anterior or posterior neural ectoderm-like cells revealed these were lineage committed to forebrain/midbrain versus hindbrain fates, respectively. They harbored diverging chromatin landscapes foreshadowing future forebrain/midbrain versus hindbrain identities. We further differentiated human pluripotent stem cells into hindbrain rhombomere 5/6-specific motor neurons, which were hitherto difficult to generate in vitro. Hence, we postulate the brain is a composite organ emanating from two lineage-restricted progenitors; these dual progenitors may be evolutionarily conserved across 550 million years from hemichordates to mammals.
This is a preview of subscription content, [access via your institution](https://wayf.springernature.com?redirect_uri=https%3A%2F%2Fwww.nature.com%2Farticles%2Fs41593-026-02433-7)
Access options #
Access Nature and 54 other Nature Portfolio journals
Get Nature+, our best-value online-access subscription
27,99 € / 30 days
cancel any time
Subscribe to this journal
Receive 12 print issues and online access
269,00 € per year
only 22,42 € per issue
Buy this article
- Purchase on SpringerLink
- Instant access to the full article PDF.
39,95 €
Prices may be subject to local taxes which are calculated during checkout
Data availability #
Bulk-population RNAseq, scRNAseq and OmniATAC-sequencing datasets generated as part of this study are available at the NCBI Gene Expression Omnibus (accession nos. GSE286146 (OmniATAC-sequencing), GSE286147 (bulk RNAseq) and GSE286148 (scRNAseq)). These datasets are grouped under SuperSeries accession no. GSE286214. An interactive web browser to explore scRNAseq data of the hPS cell-derived cell types generated in this study is available at https://anglohlabs.shinyapps.io/dundes_jokhai_lohlab/. Source data are provided with this paper.
Code availability #
Computational scripts used in this study to analyze sequencing datasets are available via GitHub at https://github.com/lohlaboratory/ane-pne.
References #
- Moens, C. B. & Prince, V. E. Constructing the hindbrain: insights from the zebrafish. *Dev. Dyn.*224 , 1–17https://doi.org/10.1002/dvdy.10086 (2002).
- Krumlauf, R. & Wilkinson, D. G. Segmentation and patterning of the vertebrate hindbrain. Development148 , dev186460https://doi.org/10.1242/dev.186460 (2021).
- Philippidou, P. & Dasen, J. S. Hox genes: choreographers in neural development, architects of circuit organization. Neuron80 , 12–34https://doi.org/10.1016/j.neuron.2013.09.020 (2013).
- Li, L. et al. Location of transient ectodermal progenitor potential in mouse development. Development140 , 4533–4543 (2013).
- Groves, A. K. & LaBonne, C. Setting appropriate boundaries: fate, patterning and competence at the neural plate border. *Dev. Biol.*389 , 2–12https://doi.org/10.1016/j.ydbio.2013.11.027 (2014).
- Stern, C. D. Neural induction: old problem, new findings, yet more questions. Development132 , 2007–2021https://doi.org/10.1242/dev.01794 (2005).
- Joyner, A. L., Liu, A. & Millet, S. Otx2, Gbx2 and Fgf8 interact to position and maintain a mid-hindbrain organizer. *Curr. Opin. Cell Biol.*12 , 736–741 (2000).
- Nieuwkoop, P. D. Activation and organization of the central nervous system in amphibians. Part III. Synthesis of a new working hypothesis. *J. Exp. Zool.*120 , 83–108https://doi.org/10.1002/jez.1401200104 (1952).
- Tao, Y. & Zhang, S.-C. Neural subtype specification from human pluripotent stem cells. Cell Stem Cell19 , 573–586https://doi.org/10.1016/j.stem.2016.10.015 (2016).
- Muguruma, K. & Sasai, Y. In vitro recapitulation of neural development using embryonic stem cells: from neurogenesis to histogenesis. *Dev. Growth Diff.*54 , 349–357https://doi.org/10.1111/j.1440-169X.2012.01329.x (2012).
- Woo, K. & Fraser, S. E. Order and coherence in the fate map of the zebrafish nervous system. Development121 , 2595–2609https://doi.org/10.1242/dev.121.8.2595 (1995).
- Keller, R., Shih, J. & Sater, A. The cellular basis of the convergence and extension of the Xenopus neural plate.*Dev. Dyn.*193 , 199–217https://doi.org/10.1002/aja.1001930302 (1992).
- Fernandez-Garre, P., Rodriguez-Gallardo, L., Gallego-Diaz, V., Alvarez, I. S. & Puelles, L. Fate map of the chicken neural plate at stage 4. Development129 , 2807–2822https://doi.org/10.1242/dev.129.12.2807 (2002).
- Tam, P. P. Regionalisation of the mouse embryonic ectoderm: allocation of prospective ectodermal tissues during gastrulation. Development107 , 55–67 (1989).
- Sunmonu, N. A., Li, K., Guo, Q. & Li, J. Y. H. Gbx2 and Fgf8 are sequentially required for formation of the midbrain–hindbrain compartment boundary. Development138 , 725–734https://doi.org/10.1242/dev.055665 (2011).
- Hemmati-Brivanlou, A. & Melton, D. Vertebrate embryonic cells will become nerve cells unless told otherwise. Cell88 , 13–17https://doi.org/10.1016/s0092-8674(00)81853-x (1997).
- Maroof, A. M. et al. Directed differentiation and functional maturation of cortical interneurons from human embryonic stem cells. Cell Stem Cell12 , 559–572https://doi.org/10.1016/j.stem.2013.04.008 (2013).
- Nicholas, C. R. et al. Functional maturation of hPSC-derived forebrain interneurons requires an extended timeline and mimics human neural development. Cell Stem Cell12 , 573–586https://doi.org/10.1016/j.stem.2013.04.005 (2013).
- Chambers, S. M. et al. Highly efficient neural conversion of human ES and iPS cells by dual inhibition of SMAD signaling. *Nat. Biotechnol.*27 , 275–280 (2009).
- Rifes, P. et al. Modeling neural tube development by differentiation of human embryonic stem cells in a microfluidic WNT gradient. *Nat. Biotechnol.*38 , 1265–1273https://doi.org/10.1038/s41587-020-0525-0 (2020).
- Kirkeby, A. et al. Generation of regionally specified neural progenitors and functional neurons from human embryonic stem cells under defined conditions. *Cell Rep.*1 , 703–714https://doi.org/10.1016/j.celrep.2012.04.009 (2012).
- Lu, J. et al. Generation of serotonin neurons from human pluripotent stem cells. *Nat. Biotechnol.*34 , 89–94https://doi.org/10.1038/nbt.3435 (2016).
- Lippmann, E. S. et al. Deterministic HOX patterning in human pluripotent stem cell-derived neuroectoderm. *Stem Cell Rep.*4 , 632–644https://doi.org/10.1016/j.stemcr.2015.02.018 (2015).
- Maury, Y. et al. Combinatorial analysis of developmental cues efficiently converts human pluripotent stem cells into multiple neuronal subtypes. *Nat. Biotechnol.*33 , 89–96https://doi.org/10.1038/nbt.3049 (2015).
- Atamian, A. et al. Human cerebellar organoids with functional Purkinje cells. Cell Stem Cell31 , 39–51https://doi.org/10.1016/j.stem.2023.11.013 (2024).
- Rathore, G. S. et al. Mapping early patterning events in human neural development using an in-vitro microfluidic stem cell model. Preprint at bioRxivhttps://doi.org/10.1101/2025.05.23.655442 (2025).
- Amin, N. D. et al. Generating human neural diversity with a multiplexed morphogen screen in organoids. Cell Stem Cell31 , 1831–1846https://doi.org/10.1016/j.stem.2024.10.016 (2024).
- Funato, K., Smith, R. C., Saito, Y. & Tabar, V. Dissecting the impact of regional identity and the oncogenic role of human-specific NOTCH2NL in an hESC model of H3.3G34R-mutant glioma. Cell Stem Cell28 , 894–905https://doi.org/10.1016/j.stem.2021.02.003 (2021).
- Loh, K. M. et al. Efficient endoderm induction from human pluripotent stem cells by logically directing signals controlling lineage bifurcations. Cell Stem Cell14 , 237–252 (2014).
- Loh, K. M. et al. Mapping the pairwise choices leading from pluripotency to human bone, heart, and other mesoderm cell types. Cell166 , 451–467https://doi.org/10.1016/j.cell.2016.06.011 (2016).
- Greber, B. et al. FGF signalling inhibits neural induction in human embryonic stem cells. *EMBO J.*30 , 4874–4884https://doi.org/10.1038/emboj.2011.407 (2011).
- Ang, S. L., Conlon, R. A., Jin, O. & Rossant, J. Positive and negative signals from mesoderm regulate the expression of mouse Otx2 in ectoderm explants. Development120 , 2979–2989 (1994).
- Bouillet, P., Chazaud, C., Oulad-Abdelghani, M., Dolle, P. & Chambon, P. Sequence and expression pattern of the Stra7 (Gbx-2) homeobox-containing gene induced by retinoic acid in P19 embryonal carcinoma cells. *Dev. Dyn.*204 , 372–382https://doi.org/10.1002/aja.1002040404 (1995).
- Wassarman, K. M. et al. Specification of the anterior hindbrain and establishment of a normal mid/hindbrain organizer is dependent on Gbx2 gene function. Development124 , 2923–2934https://doi.org/10.1242/dev.124.15.2923 (1997).
- Wood, H. B. & Episkopou, V. Comparative expression of the mouse Sox1, Sox2 and Sox3 genes from pre-gastrulation to early somite stages. *Mech. Dev.*86 , 197–201 (1999).
- Zhang, X. et al. Pax6 is a human neuroectoderm cell fate determinant. Cell Stem Cell7 , 90–100 (2010).
- Murphy, P. & Hill, R. E. Expression of the mouse labial-like homeobox-containing genes, Hox 2.9 and Hox 1.6, during segmentation of the hindbrain. Development111 , 61–74https://doi.org/10.1242/dev.111.1.61 (1991).
- Sun, X., Meyers, E. N., Lewandoski, M. & Martin, G. R. Targeted disruption of Fgf8 causes failure of cell migration in the gastrulating mouse embryo. *Genes Dev.*13 , 1834–1846 (1999).
- Rhinn, M. et al. Cloning, expression and relationship of zebrafish gbx1 and gbx2 genes to Fgf signaling. *Mech. Dev.*120 , 919–936https://doi.org/10.1016/s0925-4773(03)00135-7 (2003).
- Liu, A., Losos, K. & Joyner, A. L. FGF8 can activate Gbx2 and transform regions of the rostral mouse brain into a hindbrain fate. Development126 , 4827–4838https://doi.org/10.1242/dev.126.21.4827 (1999).
- Li, J. Y. & Joyner, A. L. Otx2 and Gbx2 are required for refinement and not induction of mid-hindbrain gene expression. Development128 , 4979–4991https://doi.org/10.1242/dev.128.24.4979 (2001).
- Kudoh, T., Wilson, S. W. & Dawid, I. B. Distinct roles for Fgf, Wnt and retinoic acid in posteriorizing the neural ectoderm. Development129 , 4335–4346https://doi.org/10.1242/dev.129.18.4335 (2002).
- Ribes, V., Le Roux, I., Rhinn, M., Schuhbaur, B. & Dolle, P. Early mouse caudal development relies on crosstalk between retinoic acid, Shh and Fgf signalling pathways. Development136 , 665–676https://doi.org/10.1242/dev.016204 (2009).
- Crossley, P. H. & Martin, G. R. The mouse Fgf8 gene encodes a family of polypeptides and is expressed in regions that direct outgrowth and patterning in the developing embryo. Development121 , 439–451 (1995).
- Wymeersch, F. J., Wilson, V. & Tsakiridis, A. Understanding axial progenitor biology in vivo and in vitro. Development148 , dev180612https://doi.org/10.1242/dev.180612 (2021).
- Nordström, U., Jessell, T. M. & Edlund, T. Progressive induction of caudal neural character by graded Wnt signaling. *Nat. Neurosci.*5 , 525–532 (2002).
- Tchieu, J. et al. A modular platform for differentiation of human PSCs into all major ectodermal lineages. Cell Stem Cell21 , 399–410https://doi.org/10.1016/j.stem.2017.08.015 (2017).
- Chen, L., Guo, Q. & Li, J. Y. Transcription factor Gbx2 acts cell-nonautonomously to regulate the formation of lineage-restriction boundaries of the thalamus. Development136 , 1317–1326https://doi.org/10.1242/dev.030510 (2009).
- Zovein, A. C. et al. Fate tracing reveals the endothelial origin of hematopoietic stem cells. Cell Stem Cell3 , 625–636 (2008).
- Fowler, J. L. et al. Lineage-tracing hematopoietic stem cell origins in vivo to efficiently make human HLF <sup>+</sup> HOXA<sup>+</sup> hematopoietic progenitors from pluripotent stem cells.Dev. Cell59 , 1110–1131https://doi.org/10.1016/j.devcel.2024.03.003 (2024).
- Arnold, K. et al. Sox2 <sup>+</sup> adult stem and progenitor cells are important for tissue regeneration and survival of mice.Cell Stem Cell9 , 317–329https://doi.org/10.1016/j.stem.2011.09.001 (2011).
- Snippert, H. J. et al. Intestinal crypt homeostasis results from neutral competition between symmetrically dividing Lgr5 stem cells. Cell143 , 134–144https://doi.org/10.1016/j.cell.2010.09.016 (2010).
- Waddington, C. H. Organisers and Genes . (Cambridge Univ. Press, 1940).
- McMahon, A. P., Joyner, A. L., Bradley, A. & McMahon, J. A. The midbrain–hindbrain phenotype of Wnt-1-/Wnt-1- mice results from stepwise deletion of engrailed-expressing cells by 9.5 days postcoitum. Cell69 , 581–595 (1992).
- Cordes, S. P. & Barsh, G. S. The mouse segmentation gene kr encodes a novel basic domain-leucine zipper transcription factor. Cell79 , 1025–1034https://doi.org/10.1016/0092-8674(94)90033-7 (1994).
- Wiellette, E. L. & Sive, H. vhnf1 and Fgf signals synergize to specify rhombomere identity in the zebrafish hindbrain. Development130 , 3821–3829https://doi.org/10.1242/dev.00572 (2003).
- Maves, L., Jackman, W. & Kimmel, C. B. FGF3 and FGF8 mediate a rhombomere 4 signaling activity in the zebrafish hindbrain. Development129 , 3825–3837https://doi.org/10.1242/dev.129.16.3825 (2002).
- Marín, F. & Charnay, P. Hindbrain patterning: FGFs regulate Krox20 and mafB/kr expression in the otic/preotic region. Development127 , 4925–4935https://doi.org/10.1242/dev.127.22.4925 (2000).
- Gurdon, J. B., Lemaire, P. & Kato, K. Community effects and related phenomena in development. Cell75 , 831–834https://doi.org/10.1016/0092-8674(93)90526-v (1993).
- Hébert, J. M. & Fishell, G. The genetics of early telencephalon patterning: some assembly required. *Nat. Rev. Neurosci.*9 , 678–685https://doi.org/10.1038/nrn2463 (2008).
- Hernandez-Miranda, L. R., Muller, T. & Birchmeier, C. The dorsal spinal cord and hindbrain: from developmental mechanisms to functional circuits. *Dev. Biol.*432 , 34–42https://doi.org/10.1016/j.ydbio.2016.10.008 (2017).
- Gunhaga, L. et al. Specification of dorsal telencephalic character by sequential Wnt and FGF signaling. *Nat. Neurosci.*6 , 701–707https://doi.org/10.1038/nn1068 (2003).
- Backman, M. et al. Effects of canonical Wnt signaling on dorso-ventral specification of the mouse telencephalon. *Dev. Biol.*279 , 155–168https://doi.org/10.1016/j.ydbio.2004.12.010 (2005).
- Nasif, S. et al. Islet 1 specifies the identity of hypothalamic melanocortin neurons and is critical for normal food intake and adiposity in adulthood. Proc. Natl Acad. Sci. USA112 , E1861–E1870https://doi.org/10.1073/pnas.1500672112 (2015).
- Zhuang, S. et al. Expression of Isl1 during mouse development. Gene Expr. Patterns13 , 407–412https://doi.org/10.1016/j.gep.2013.07.001 (2013).
- Pattyn, A., Morin, X., Cremer, H., Goridis, C. & Brunet, J. F. Expression and interactions of the two closely related homeobox genes Phox2a and Phox2b during neurogenesis. Development124 , 4065–4075https://doi.org/10.1242/dev.124.20.4065 (1997).
- Paxton, C. N., Bleyl, S. B., Chapman, S. C. & Schoenwolf, G. C. Identification of differentially expressed genes in early inner ear development. Gene Expr. Patterns10 , 31–43https://doi.org/10.1016/j.gep.2009.11.002 (2010).
- Millet, S., Bloch-Gallego, E., Simeone, A. & Alvarado-Mallart, R. M. The caudal limit of Otx2 gene expression as a marker of the midbrain/hindbrain boundary: a study using in situ hybridisation and chick/quail homotopic grafts. Development122 , 3785–3797https://doi.org/10.1242/dev.122.12.3785 (1996).
- Li, Y., Allende, M. L., Finkelstein, R. & Weinberg, E. S. Expression of two zebrafish orthodenticle-related genes in the embryonic brain. *Mech. Dev.*48 , 229–244https://doi.org/10.1016/0925-4773(94)90062-0 (1994).
- Pani, A. M. et al. Ancient deuterostome origins of vertebrate brain signalling centres. Nature483 , 289–294https://doi.org/10.1038/nature10838 (2012).
- Kelly, R. G., Buckingham, M. E. & Moorman, A. F. Heart fields and cardiac morphogenesis. *Cold Spring Harb. Perspect. Med.*4 , a015750https://doi.org/10.1101/cshperspect.a015750 (2014).
- Gardner, C. A. & Barald, K. F. The cellular environment controls the expression of engrailed-like protein in the cranial neuroepithelium of quail–chick chimeric embryos. Development113 , 1037–1048https://doi.org/10.1242/dev.113.3.1037 (1991).
- Martinez, S., Wassef, M. & Alvarado-Mallart, R. M. Induction of a mesencephalic phenotype in the 2-day-old chick prosencephalon is preceded by the early expression of the homeobox gene en. Neuron6 , 971–981https://doi.org/10.1016/0896-6273(91)90237-t (1991).
- Broccoli, V., Boncinelli, E. & Wurst, W. The caudal limit of Otx2 expression positions the isthmic organizer. Nature401 , 164–168https://doi.org/10.1038/43670 (1999).
- Pankratz, M. T. et al. Directed neural differentiation of human embryonic stem cells via an obligated primitive anterior stage. Stem Cells25 , 1511–1520https://doi.org/10.1634/stemcells.2006-0707 (2007).
- Martinez, S., Crossley, P. H., Cobos, I., Rubenstein, J. L. & Martin, G. R. FGF8 induces formation of an ectopic isthmic organizer and isthmocerebellar development via a repressive effect on Otx2 expression. Development126 , 1189–1200https://doi.org/10.1242/dev.126.6.1189 (1999).
- Pijuan-Sala, B. et al. A single-cell molecular map of mouse gastrulation and early organogenesis. Nature566 , 490–495https://doi.org/10.1038/s41586-019-0933-9 (2019).
- Zhai, J. et al. Primate gastrulation and early organogenesis at single-cell resolution. Nature612 , 732–738https://doi.org/10.1038/s41586-022-05526-y (2022).
- Williams, R. M., Lukoseviciute, M., Sauka-Spengler, T. & Bronner, M. E. Single-cell atlas of early chick development reveals gradual segregation of neural crest lineage from the neural plate border during neurulation. Elife11 , e74464https://doi.org/10.7554/eLife.74464 (2022).
- Wagner, D. E. et al. Single-cell mapping of gene expression landscapes and lineage in the zebrafish embryo. Science360 , 981–987https://doi.org/10.1126/science.aar4362 (2018).
- Madisen, L. et al. A robust and high-throughput Cre reporting and characterization system for the whole mouse brain. *Nat. Neurosci.*13 , 133–140https://doi.org/10.1038/nn.2467 (2010).
- Ferrer-Vaquer, A. et al. A sensitive and bright single-cell resolution live imaging reporter of Wnt/β-catenin signaling in the mouse. *BMC Dev. Biol.*10 , 121https://doi.org/10.1186/1471-213X-10-121 (2010).
- Choi, H. M. T. et al. Third-generation in situ hybridization chain reaction: multiplexed, quantitative, sensitive, versatile, robust. Development145 , dev165753https://doi.org/10.1242/dev.165753 (2018).
- Schindelin, J. et al. Fiji: an open-source platform for biological-image analysis. Nat. Methods9 , 676–682https://doi.org/10.1038/nmeth.2019 (2012).
- Ang, L. T. et al. Generating human artery and vein cells from pluripotent stem cells highlights the arterial tropism of Nipah and Hendra viruses. Cell185 , 2523–2541https://doi.org/10.1016/j.cell.2022.05.024 (2022).
- Loh, K. M. et al. Protocol for efficient generation of human artery and vein endothelial cells from pluripotent stem cells. *STAR Protoc.*6 , 103494https://doi.org/10.1016/j.xpro.2024.103494 (2025).
- Thomson, J. A. et al. Embryonic stem cell lines derived from human blastocysts. Science282 , 1145–1147 (1998).
- Davis, R. P. et al. Targeting a GFP reporter gene to the MIXL1 locus of human embryonic stem cells identifies human primitive streak-like cells and enables isolation of primitive hematopoietic precursors. Blood111 , 1876–1884 (2008).
- Maddah, M. et al. A non-invasive platform for functional characterization of stem-cell-derived cardiomyocytes with applications in cardiotoxicity testing. *Stem Cell Rep.*4 , 621–631https://doi.org/10.1016/j.stemcr.2015.02.007 (2015).
- Qi, Y. et al. Combined small-molecule inhibition accelerates the derivation of functional cortical neurons from human pluripotent stem cells. *Nat. Biotechnol.*35 , 154–163https://doi.org/10.1038/nbt.3777 (2017).
- Bray, N. L., Pimentel, H., Melsted, P. & Pachter, L. Near-optimal probabilistic RNA-seq quantification. *Nat. Biotechnol.*34 , 525–527https://doi.org/10.1038/nbt.3519 (2016).
- Soneson, C., Love, M. I. & Robinson, M. D. Differential analyses for RNA-seq: transcript-level estimates improve gene-level inferences. *F1000Res.*4 , 1521https://doi.org/10.12688/f1000research.7563.2 (2015).
- Ramirez, F. et al. deepTools2: a next generation web server for deep-sequencing data analysis. *Nucleic Acids Res.*44 , W160–W165https://doi.org/10.1093/nar/gkw257 (2016).
- Robinson, J. T. et al. Integrative genomics viewer. *Nat. Biotechnol.*29 , 24–26https://doi.org/10.1038/nbt.1754 (2011).
- Zheng, G. X. Y. et al. Massively parallel digital transcriptional profiling of single cells. *Nat. Commun.*8 , 14049https://doi.org/10.1038/ncomms14049 (2017).
- Wolf, F. A., Angerer, P. & Theis, F. J. SCANPY: large-scale single-cell gene expression data analysis. *Genome Biol.*19 , 15https://doi.org/10.1186/s13059-017-1382-0 (2018).
- Becht, E. et al. Dimensionality reduction for visualizing single-cell data using UMAP. *Nat. Biotechnol.*37 , 38–44https://doi.org/10.1038/nbt.4314 (2019).
- Corces, M. R. et al. An improved ATAC-seq protocol reduces background and enables interrogation of frozen tissues. Nat. Methods14 , 959–962https://doi.org/10.1038/nmeth.4396 (2017).
- Langmead, B. & Salzberg, S. L. Fast gapped-read alignment with Bowtie 2. Nat. Methods9 , 357–359https://doi.org/10.1038/nmeth.1923 (2012).
- Zhang, Y. et al. Model-based analysis of ChIP-Seq (MACS). Genome Biol9 , R137 (2008).
- Siepel, A. et al. Evolutionarily conserved elements in vertebrate, insect, worm, and yeast genomes. *Genome Res.*15 , 1034–1050https://doi.org/10.1101/gr.3715005 (2005).
- Love, M. I., Huber, W. & Anders, S. Moderated estimation of fold change and dispersion for RNA-seq data with DESeq2. *Genome Biol.*15 , 550https://doi.org/10.1186/s13059-014-0550-8 (2014).
- Heinz, S. et al. Simple combinations of lineage-determining transcription factors prime cis -regulatory elements required for macrophage and B cell identities.Mol. Cell38 , 576–589 (2010).
- Chen, T. W. et al. Ultrasensitive fluorescent proteins for imaging neuronal activity. Nature499 , 295–300https://doi.org/10.1038/nature12354 (2013).
- Kim, Y. S. et al. Crystal structure of the natural anion-conducting channelrhodopsin GtACR1. Nature561 343–348https://doi.org/10.1038/s41586-018-0511-6 (2018).
- Rajasethupathy, P. et al. Projections from neocortex mediate top-down control of memory retrieval. Nature526 , 653–659https://doi.org/10.1038/nature15389 (2015).
- Lukashchuk, V., Lewis, K. E., Coldicott, I., Grierson, A. J. & Azzouz, M. AAV9-mediated central nervous system-targeted gene delivery via cisterna magna route in mice. *Mol. Ther. Methods Clin. Dev.*3 , 15055https://doi.org/10.1038/mtm.2015.55 (2016).
- Hsu, C. W. et al. EZ Clear for simple, rapid, and robust mouse whole organ clearing. Elife11 , e77419https://doi.org/10.7554/eLife.77419 (2022).
- Babicki, S. et al. Heatmapper: web-enabled heat mapping for all. *Nucleic Acids Res.*44 , W147–W153https://doi.org/10.1093/nar/gkw419 (2016).
- Hart, A. H., Hartley, L., Ibrahim, M. & Robb, L. Identification, cloning and expression analysis of the pluripotency promoting Nanog genes in mouse and human. *Dev. Dyn.*230 , 187–198 (2004).
- Hoffman, J. A., Wu, C.-I. & Merrill, B. J. Tcf7l1 prepares epiblast cells in the gastrulating mouse embryo for lineage specification. Development140 , 1665–1675 (2013).
- Miao, Y. et al. Next-generation surrogate Wnts support organoid growth and deconvolute Frizzled pleiotropy in vivo. Cell Stem Cell27 , 840–851https://doi.org/10.1016/j.stem.2020.07.020 (2020).
- Burns, C. J. et al. Investigation of Frizzled-5 during embryonic neural development in mouse. *Dev. Dyn.*237 , 1614–1626https://doi.org/10.1002/dvdy.21565 (2008).
- Sheng, H. Z. et al. Expression of murine Lhx5 suggests a role in specifying the forebrain. *Dev. Dyn.*208 , 266–277 (1997).
- Hirata, T. et al. Zinc finger gene fez-like functions in the formation of subplate neurons and thalamocortical axons. *Dev. Dyn.*230 , 546–556https://doi.org/10.1002/dvdy.20068 (2004).
- Waskiewicz, A. J., Rikhof, H. A., Hernandez, R. E. & Moens, C. B. Zebrafish Meis functions to stabilize Pbx proteins and regulate hindbrain patterning. Development128 , 4139–4151https://doi.org/10.1242/dev.128.21.4139 (2001).
- Moreau, M. X., Saillour, Y., Cwetsch, A. W., Pierani, A. & Causeret, F. Single-cell transcriptomics of the early developing mouse cerebral cortex disentangle the spatial and temporal components of neuronal fate acquisition. Development148 , dev197962https://doi.org/10.1242/dev.197962 (2021).
- Lavado, A. & Oliver, G. Prox1 expression patterns in the developing and adult murine brain. *Dev. Dyn.*236 , 518–524https://doi.org/10.1002/dvdy.21024 (2007).
- Abellan, A., Vernier, B., Retaux, S. & Medina, L. Similarities and differences in the forebrain expression of Lhx1 and Lhx5 between chicken and mouse: Insights for understanding telencephalic development and evolution. *J. Comp. Neurol.*518 , 3512–3528https://doi.org/10.1002/cne.22410 (2010).
- Hannibal, J., Mikkelsen, J. D., Fahrenkrug, J. & Larsen, P. J. Pituitary adenylate cyclase-activating peptide gene expression in corticotropin-releasing factor-containing parvicellular neurons of the rat hypothalamic paraventricular nucleus is induced by colchicine, but not by adrenalectomy, acute osmotic, ether, or restraint stress. Endocrinology136 , 4116–4124https://doi.org/10.1210/endo.136.9.7649120 (1995).
- Palkovits, M., Somogyvari-Vigh, A. & Arimura, A. Concentrations of pituitary adenylate cyclase activating polypeptide (PACAP) in human brain nuclei. *Brain Res.*699 , 116–120https://doi.org/10.1016/0006-8993(95)00869-r (1995).
- Acampora, D. et al. Progressive impairment of developing neuroendocrine cell lineages in the hypothalamus of mice lacking the Orthopedia gene. *Genes Dev.*13 , 2787–2800https://doi.org/10.1101/gad.13.21.2787 (1999).
- Yu, H., Rubinstein, M. & Low, M. J. Developmental single-cell transcriptomics of hypothalamic POMC neurons reveal the genetic trajectories of multiple neuropeptidergic phenotypes. Elife11 , e72883https://doi.org/10.7554/eLife.72883 (2022).
- Hashimoto, H. et al. Distribution of the mRNA for a pituitary adenylate cyclase-activating polypeptide receptor in the rat brain: an in situ hybridization study. *J. Comp. Neurol.*371 , 567–577 (1996).
- Alaynick, W. A., Jessell, T. M. & Pfaff, S. L. SnapShot: spinal cord development. Cell146 , 178–178 (2011).
- Shimamura, K. & Rubenstein, J. L. Inductive interactions direct early regionalization of the mouse forebrain. Development124 , 2709–2718 (1997).
Acknowledgements #
We thank J. Li, B. Conklin, T. Anbarchian, R. Nusse, F. Suchy, H. Nakauchi, A. Elefanty, Ed. Stanley and E. Ng for sharing reagents. We also thank S. Vijayakumar, B. Woodruff, C. Anselmi and A. Voskoboynik for contributing to experiments, and W. Talbot, A. Zorn, K. Campbell, R. Krumlauf, P. Beachy, C. Shatz, J. Day, A. Pollen, T. Nowakowski, L. T. Ang and N. Uchida for advice. Infrastructure support was provided by V. Park, L. Ou, K. Lee, C. Carswell-Crumpton, P. Lovelace, L. Dunkin-Hubby and the Stanford Institute for Stem Cell Biology and Regenerative Medicine, Stem Cell FACS Core Facility, Veterinary Service Center, Cell Sciences Imaging Facility and Diabetes Research Center.
Funding #
This work was supported by the US National Institutes of Health (grant nos. DP5OD024558 and P30DK116074 to K.M.L., DP2GM146258 and R00GM121852 to D.E.W., R01DK115728 to K.C.G., R01DE027538 to M.E.B., T32GM119995 to C.E.D., T32GM007365 and T32GM007790 to R.T.J., T32GM141828 to A.R. and F31DE031154 to H.A.U.), the US National Science Foundation (grant no. IOS1656628 to C.J.L.); the California Institute of Regenerative Medicine (grant nos. TB1-01195 to R.E.A.S.-S. and EDUC2-12677 to A.S.P.); the Spinal Muscular Atrophy Foundation (K.M.L.); the Stanford Maternal and Child Health Research Institute (K.M.L.); the Stanford Beckman Center (K.M.L.); the Stanford Ludwig Center (K.M.L.); the Siebel Stem Cell Institute (K.M.L.); the Stinehart-Reed Seed Grant (K.M.L.); Anonymous, Fickel and Gilbert families (K.M.L.); the Gatsby Charitable Foundation (M.M.); the Howard Hughes Medical Institute (M.M. and K.C.G.); the Ford Foundation, Stanford Graduate and Stanford DARE Fellowships (C.E.D.); the Stanford Medical Scholars Research Program (R.T.J.), the Yale Saybrook College and Stacey Leondis Fellowships (C.X.); and the Stanford MCHRI and Dean’s Postdoctoral Fellowships (Y.Q.). K.M.L. was supported as a Packard Foundation Fellow, Pew Scholar, Baxter Foundation Faculty Scholar, Human Frontier Science Program Young Investigator (RGY0069/2019) and Anthony DiGenova Endowed Faculty Scholar. The funders had no role in study design, data collection and analysis, decision to publish or preparation of the manuscript.
Ethics declarations #
Competing interests
Stanford University has filed patent applications related to neural differentiation, with K.M.L., R.E.A.S.-S., C.E.D., H.A. and R.T.J. listed as inventors. The other authors declare no competing interests.
Peer review #
Peer review information
Nature Neuroscience thanks the anonymous reviewer(s) for their contribution to the peer review of this work.
Additional information #
Publisher’s note Springer Nature remains neutral with regard to jurisdictional claims in published maps and institutional affiliations.
Extended data #
Extended Data Fig. 1 Definitive ectoderm and neural ectoderm marker expression.
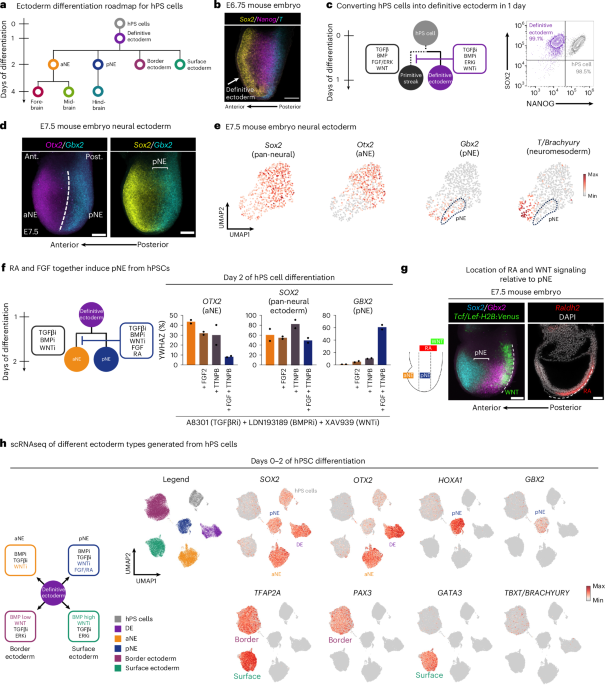
a) Single-cell RNA-sequencing of E6.75 mouse embryos; analysis performed on a previously-published resource<sup>77</sup>. Embryonic cells are shown, with extraembryonic cells excluded (Elf5 and Rhox5 log<sub>2</sub> normalized expression = 0). Otx2 is expressed in definitive ectoderm and pluripotent cells, consistent with previous studies<sup>4,32</sup>. Oct4 (Pou5f1) is broadly expressed across all cell-types, consistent with past studies<sup>110,111</sup>. b) Immunostaining of hPS cells before, or after, differentiation into definitive ectoderm for 24 hours. NANOG and SOX2 immunostaining was performed with H7 hPS cells. OTX2 immunostaining was performed with H1 hPS cells. Scale bar = 100 μm. Representative images from 2 biological replicates in 1 experiment. c) Flow cytometry of H1 hPS cells differentiated into definitive ectoderm for 24 hours. The percentage of SOX2 + NANOG- definitive ectoderm cells is shown. Each dot represents 1 independent differentiation experiment, with 3 experiments shown. d) Flow cytometry of HES3 MIXL1-GFP hPS cells differentiated into definitive ectoderm (day 1), anterior neural ectoderm (day 2), posterior neural ectoderm (day 2), border ectoderm (day 2), surface ectoderm (day 1), or mid primitive streak<sup>30</sup> (day 1, as a positive control to induce MIXL1 expression). Negligible numbers of MIXL1+ primitive streak cells emerged after ectoderm differentiation, reaffirming the suppression of spurious primitive streak differentiation. Representative data from 2 biological replicates in 1 experiment. e) In situ staining of E7.5 mouse embryo, showing overlap of Sox2 and Gbx2 expression in pNE. Scale bar = 25 μm. Representative images from 40 embryos from 10 experiments. f) Single-cell RNA-sequencing of E7.5 mouse embryos; analysis performed on a previously-published resource<sup>77</sup>. Neural ectoderm cells (identified by log<sub>2</sub> normalized expression of Sox2 > 0.5, and Nanog, Tfap2a, Rhox5, Foxj1, and Elf5 = 0) are shown. g) Intracellular flow cytometry for SOX2 protein expression in H1 hPS cells, prior to or after differentiation into anterior neural ectoderm or posterior neural ectoderm for 2 days. The percentage of SOX2+ cells, and median fluorescence intensity (MFI) of SOX2 expression, are both shown. Representative data from 2 biological replicates in 1 experiment. h) Immunostaining of H1 hPS cells differentiated into definitive ectoderm for 24 hours, followed by differentiation into aNE or pNE for 24 hours. Scale bar = 100 μm. Representative images from 2 biological replicates in 1 experiment.
Extended Data Fig. 2 Posterior neural ectoderm induction.
a) Western Blot to detect the expression of GBX2 protein in H1 hPS cell-derived day-2 aNE or day-2 pNE. VINCULIN protein serves as a control. Images from 2 biological replicates in 1 experiment. b) β-CATENIN immunostaining of H1 hPS cells that were differentiated into various cell-types. First, hPS cells were differentiated into definitive ectoderm for 24 hours, and then treated with posterior neural ectoderm-inducing media for 24 hours (A-83-01 [1 μM] + LDN193189 [100 nM] + TTNPB [50 nM] + FGF2 [20 ng/mL] + XAV939 [1 μM] + Thiazovivin [1 μM]), or as a positive control to induce nuclear β-CATENIN, modified posterior neural ectoderm media lacking WNT inhibitor and including a WNT agonist for 24 hours (A-83-01 [1 μM] + LDN193189 [100 nM] + TTNPB [50 nM] + FGF2 [20 ng/mL] + CHIR99021 [2 μM] + Thiazovivin [1 μM]). Alternatively, as a positive control to induce nuclear β-CATENIN, hPS cells were differentiated into mid primitive streak, with WNT agonist-containing media (Activin A [30 ng/mL] + BMP4 [40 ng/mL] + CHIR99021 [6 μM] + FGF2 [20 ng/mL]) for 24 hours. Nuclear β-CATENIN was absent from hPSC-derived posterior neural ectoderm, and either weakly or strongly positive in the two WNT agonist-treated cell populations. Scale bar = 100 μm. Representative images from 2 biological replicates in 2 experiments.
Extended Data Fig. 3 Differentiation of hPSCs into anterior neural, posterior neural, border or surface ectoderm.
a) Summary of the hPSC differentiation strategy described in this study. b) Top: In situ hybridization of H1 hPSCs differentiated into definitive ectoderm for 24 hours, followed by differentiation into aNE or pNE for 24 hours. Scale: 100 μm. Bottom: Immunostaining of H1 hPSCs differentiated into definitive ectoderm for 24 hours, followed by differentiation into border or surface ectoderm for 24 hours. Scale: 100 μm. Percentages of cells expressing a given marker are shown. Representative images from 2 biological replicates in 2 experiments.
Extended Data Fig. 4 Lineage tracing of neural ectoderm cells within mouse embryos.
a) In situ staining of E9.5 Gbx2-CreER; ROSA26-tdTomato mouse embryo that was not exposed to 4OHT. This negative control revealed minimal Gbx2-CreER-driven recombination in the absence of 4OHT. Scale bar = 500 μm. Image of 1 embryo from 1 experiment. b) E7.0 Gbx2-CreER; ROSA26-LoxP-STOP-LoxP-tdTomato mouse embryos were exposed to 1 mg 4OHT (intraperitoneally delivered into pregnant females) to label Gbx2<sup>+</sup> pNE with tdTomato. Subsequently, in situ staining was performed on E8.25 embryos to visualize pNE-derived progeny in relation to the expression of Wnt1 (which marks the midbrain/hindbrain boundary) and Gbx2 (which marks the hindbrain). Scale bar = 100 μm. Representative images from 18 embryos from 4 experiments. c) E7.5 Sox2-CreER; Confetti mouse embryos were exposed to 0.5 mg 4OHT (intraperitoneally delivered into pregnant females) to label single E7.5 Sox2<sup>+</sup> neural ectoderm progenitors with one of three detectable fluorescent colors (red, cyan, or yellow). Subsequently, E9.5 embryos were immunostained to visualize neural ectoderm-derived cell clusters and where they resided in relation to the forebrain, midbrain, and hindbrain; photos of three independent embryos are shown (left). The forebrain/midbrain domain was molecularly determined by Otx2 immunostaining (left). Quantification of the locations of all neural ectoderm-derived cell clusters analyzed in this study, totaling 494 cell clusters from 16 embryos from 7 experiments (right). Scale bar = 100 μm. d) Detailed analysis of the spatial position of a E7.5 Sox2<sup>+</sup> neural ectoderm-derived cell cluster relative to the midbrain/hindbrain boundary. E7.5 Sox2-CreER; Confetti mouse embryos were exposed to 0.5 mg 4OHT (intraperitoneally delivered into pregnant females) to label single E7.5 Sox2<sup>+</sup> neural ectoderm progenitors with one of three detectable fluorescent colors (red, cyan, or yellow). Subsequently, E9.5 embryos were immunostained to visualize neural ectoderm-derived cell clusters and where they resided in relation to the forebrain, midbrain, and hindbrain. The forebrain/midbrain domain was molecularly determined by Otx2 immunostaining. This is a higher magnification image of an embryo shown in Extended Data Fig. 4c, which was taken from 1 experiment. Asterisks indicate autofluorescence from red blood cells (RBCs). Scale bar = 100 μm.
Extended Data Fig. 5 Differentiation of hPSCs into forebrain or midbrain progenitors.
a) qPCR of H1 hPSCs differentiated into definitive ectoderm for 24 hours, followed by anterior neural ectoderm for 24 hours, and then subsequently treated with the following WNT pathway modulators for 48 hours: WNT inhibitor (XAV939, 1 μM), control media (no WNT modulator, depicted as “-”), RSPO2 (25 nM), RSPO2 + WNT3A (increasing concentrations of 10, 100 or 1000 ng/mL), RSPO2 + NGS WNT-Fc (increasing concentrations of 0.03, 0.3 or 3 nM), or CHIR99021 (increasing concentrations of 0.75, 1.5 or 3 μM). For WNT3A or NGS WNT-Fc treatment conditions, RSPO2 was added to increase cell-surface levels of FRIZZLED receptors, thereby enhancing cellular responsiveness to these WNT pathway agonists<sup>112</sup>. NGS-WNT-Fc refers to an Fc-tagged synthetic WNT pathway agonist that acts by heterodimerizing FZD and LRP6 receptors<sup>112</sup>. Heatmap depicts row Z-score, calculated across the 12 treatment conditions from the mean normalized expression of 2 biological replicates from 1 experiment. b) In situ staining of an E8.5 Tcf/Lef:H2B:Venus reporter mouse embryo<sup>82</sup> for Foxg1 (forebrain marker) and Venus (indicating WNT transcriptional response). This disclosed a posteriorizing gradient of WNT signaling, with minimal WNT signaling in Foxg1<sup>+</sup> forebrain, but high WNT signaling in the midbrain. Representative image from 15 embryos from 2 experiments.
Extended Data Fig. 6 Lineage commitment of hPSC-derived anterior and posterior neural ectoderm.
a) scRNAseq of H7 hPSC-derived day-4 hindbrain progenitors, and day-7 dorsal hindbrain or ventral hindbrain progenitors. Colors denote differentiation conditions. An asterisk (*) indicates that the legend is identical to that shown in Fig. 4c, and is reproduced here to aid the interpretation of other images shown in this subpanel. Data from 1 biological replicate per cell-type. b) H1 hPSCs were differentiated into definitive ectoderm for 24 hours, and then subsequently differentiated into either anterior neural ectoderm (aNE) or posterior neural ectoderm (pNE) within an additional 24 hours. hPSC-derived aNE and pNE cells were then dissociated and then replated in either forebrain-, midbrain-, or hindbrain-inducing signals for 48 hours, and then immunostaining was performed. Scale bar = 50 μm. Representative images from 4 biological replicates from 4 experiments.
Extended Data Fig. 7 Accessible chromatin landscapes and lineage commitment of hPSC-derived anterior vs. posterior neural ectoderm.
a) H1 hPSCs were differentiated into either anterior or posterior neural ectoderm for 2 days. They were then respectively challenged with either forebrain-, midbrain-, or hindbrain-inducing signals for 4 days. Immunostaining was performed on day 6 of differentiation. Scale = 100 μm. Representative images from 2 biological replicates from 1 experiment. b) H1 hPSCs were differentiated into either aNE or pNE within 2 days; pNE was fluorescently labeled, and then aNE (uncolored) and pNE (dye-labeled) were mixed. Cocultures were treated with either forebrain-, midbrain-, or hindbrain-inducing signals for 4 days, prior to immunostaining (that is, immunostaining was performed on day 6 of hPSC differentiation). Quantification indicates the percentage of pNE cells (that is, dye-labeled) that express a given marker protein. aNE: day-2 anterior neural ectoderm. pNE: day-2 posterior neural ectoderm. Representative images from 4 biological replicates from 2 experiments. c) OmniATACseq was performed on day 2 H7 hPSC-derived aNE vs. pNE. A Z-score heatmap is shown, depicting all differentially accessible regions between these two cell-types (false discovery rate [FDR] < 0.05). Each row indicates an individual genomic element. Data from 3 biological replicates from 1 experiment. d) OmniATACseq was performed on day 2 H7 hPSC-derived aNE vs. pNE that were challenged with forebrain-inducing signals for 2 additional days (1 day of XAV939 [1 μM] + LDN193189 [100 nM] + FGF2 [20 ng/mL], followed by 1 day of XAV939 (1 μM) and LDN193189 [100 nM]). A Z-score heatmap is shown, depicting all differentially accessible regions between these two cell-types (FDR < 0.05). Each row indicates an individual genomic element. Data from 3 biological replicates from 1 experiment. e) OmniATACseq and RNAseq of hPSC-derived aNE and pNE that were treated with either forebrain- or hindbrain-inducing signals for 48 hours. Data from 3 biological replicates from 1 experiment. f) OmniATACseq was performed on day 2 H7 hPSC-derived aNE vs. pNE that were challenged with hindbrain-inducing signals (CHIR99021 [750 nM] + FGF2 [20 ng/mL]) for 2 additional days. A Z-score heatmap is shown, depicting all differentially accessible regions between these two cell-types (FDR < 0.05). Each row indicates an individual genomic element. Data from 3 biological replicates from 1 experiment. g) Single-cell RNA-sequencing of H7 hPSCs differentiated into day-1 definitive ectoderm, day-2 anterior neural ectoderm, day-2 posterior neural ectoderm, day-2 border ectoderm, or day-2 surface ectoderm. Colors denote differentiation conditions. Fzd5, Lhx5, and Fezf1 have previously been associated with anterior neural identity in vivo at later developmental stages<sup>113,114,115</sup>, whereas Meis2 has been previously associated with posterior neural identity in vivo<sup>116</sup>. Data from 1 biological replicate per cell-type.
Extended Data Fig. 8 Differentiation of hPSCs into dorsal forebrain and ventral forebrain progenitors within 7 days.
scRNAseq of H7 hPSC-derived day-4 hindbrain progenitors, and day-7 dorsal hindbrain or ventral hindbrain progenitors. Colors denote differentiation conditions. An asterisk (*) indicates that the legend is identical to that shown in Fig. 4c, and is reproduced here to aid the interpretation of other images shown in this subpanel. Data from 1 biological replicate per cell-type.
Extended Data Fig. 9 Differentiation of hPSCs into dorsal and ventral forebrain progenitors, and subsequently, dorsal and ventral hindbrain neurons.
a) scRNAseq of H7 hPSC-derived dorsal forebrain, ventral forebrain, dorsal hindbrain and ventral hindbrain populations on day 14 of differentiation. An asterisk (*) indicates images identical to those shown in Fig. 5d, which were reproduced here to aid the interpretation of other images shown in this subpanel. Data from 1 biological replicate per cell-type. b) scRNAseq of H7 hPSC-derived dorsal forebrain populations on day 14 of differentiation reveals expression of Cajal-Retzius neuron markers<sup>117</sup>. Data from 1 biological replicate per cell-type. c) scRNAseq of H7 hPSC-derived ventral forebrain populations on day 14 of differentiation reveals expression of cortical interneuron markers. Data from 1 biological replicate per cell-type. d) scRNAseq of H7 hPSC-derived ventral forebrain populations on day 14 of differentiation reveals expression of hypothalamus-associated markers. hPSC-derived groups I and II express PROX1 (ref. <sup>118</sup>), LHX5 (ref. <sup>119</sup>), and ADCYAP1 (ref. <sup>120,121</sup>), which are expressed in vivo by various regions of the hypothalamus, including the preoptic area, paraventricular nucleus, and supraoptic nucleus. hPSC-derived group I is additionally defined by OTP, the archetypic transcription factor required for the development of paraventricular and supraoptic nuclei<sup>122</sup>. Instead, hPSC-derived group II is additionally defined by POU4F1 (BRN3A) and EBF1, and may correspond to an early Pou4f1+ Ebf1+ Pomc- hypothalamic lineage in vivo<sup>123</sup>. hPSC-derived group II also expresses ADCYAP1R1 (the ADYCAP1 receptor), which is expressed by multiple brain regions, including the preoptic area, paraventricular nucleus, and supraoptic nucleus<sup>124</sup>. Finally, hPSC-derived group III is demarcated by ISL1 and POMC, which are expressed within the arcuate nucleus of the hypothalamus<sup>64</sup>. Data from 1 biological replicate per cell-type. e) scRNAseq of H7 hPSC-derived ventral hindbrain populations on day 14 of differentiation reveals expression of multiple ventral hindbrain neuron subtype markers (left), whose identities were extrapolated from ventral spinal cord neuron subtype markers<sup>125,126</sup>. Cartoon of progenitor domains within the developing ventral hindbrain, based on embryological studies (right)<sup>125</sup>. The box reflects the neuron subtypes putatively produced in our in vitro differentiation system. Data from 1 biological replicate per cell-type. f) scRNAseq of H7 hPSC-derived dorsal hindbrain populations on day 14 of differentiation reveals expression of multiple dorsal hindbrain neuron subtype markers (left). Cartoon of progenitor domains within the developing ventral hindbrain, based on embryological studies (right). The box reflects the neuron subtypes putatively produced in our in vitro differentiation system. Data from 1 biological replicate per cell-type.
Extended Data Fig. 10 Functional assessment of hPSC-derived dorsal and ventral hindbrain neurons.
a) Day 28 H1 hPSC-derived ventral hindbrain neurons transduced with AAVdj-CAG-bReaChES-eYFP were stimulated with either prolonged (1 second), or pulses of (5 ms, 5 Hz), 560 nm light, and electrophysiological recording was performed to detect action potentials. Representative data from 4 cells from 1 experiment. b) Electrophysiological activity of H1 hPSC-derived dorsal hindbrain neurons on day 30 of differentiation, showing voltage-dependent K<sup>+</sup> (left) or Na<sup>+</sup> (right) channel currents elicited by depolarization of the holding potential from -90 mV to 50 mV in voltage-clamp mode. Representative data from 4 cells in 1 experiment. c) Current-clamp characterization of H1 hPSC-derived dorsal hindbrain neurons on day 30 of differentiation, showing action potentials elicited by injection of pulsed (500 pA, 5 ms, 10 Hz, left) or prolonged (50 pA, 1.5 seconds, right) currents in current-clamp mode. Representative data from 4 cells in 1 experiment. d) Live Ca<sup>2+</sup> imaging of WTC11 AAVS1-CAG-GCaMP6f hPSCs differentiated into dorsal hindbrain neurons for 30 days, which exhibited spontaneous Ca<sup>2+</sup> transients as assessed within individual cells (left) and across the culture (right). Scale bar = 50 μm. Representative data from 7 single cells in 1 experiment.
Supplementary information #
Supplementary Information (download PDF )
Supplementary Figs. 1–10 and Representative flow cytometry gating schema.
Supplementary Tables 1 and 2 (download XLSX )
Supplementary Table 1 (a list of experimental reagents used in this study) and Table 2 (a list of qPCR primer sequences used in this study).
Source data #
Source Data Fig. 1 (download XLSX )
qPCR datapoints for Fig. 1.
Source Data Fig. 2 (download XLSX )
qPCR datapoints for Fig. 2.
Source Data Fig. 3 (download XLSX )
qPCR datapoints for Fig. 3.
Source Data Extended Data Fig. 1 (download XLSX )
Flow cytometry datapoints for Extended Data Fig. 1.
Source Data Extended Data Fig. 2 (download PDF )
Raw western blot gels for extended Data Fig. 2.
Source Data Extended Data Fig. 5 (download XLSX )
Flow cytometry datapoints for Extended Data Fig. 5.
Source Data Extended Data Fig. 7 (download XLSX )
Differentially accessible genomic regions for Extended Data Fig. 7. A list of genomic regions with differential accessibility in OmniATACseq datasets obtained from hPS cell-derived aNE, hPS cell-derived pNE, and aNE and pNE populations challenged with either forebrain (telencephalon)-inducing signals or hindbrain-inducing signals.
Rights and permissions #
Springer Nature or its licensor (e.g. a society or other partner) holds exclusive rights to this article under a publishing agreement with the author(s) or other rightsholder(s); author self-archiving of the accepted manuscript version of this article is solely governed by the terms of such publishing agreement and applicable law.
About this article #
Cite this article
Jokhai, R.T., Dundes, C.E., Ahsan, H.S. et al. Two parallel neural ectoderm progenitors contribute to the developing brain.
                    *Nat Neurosci*  (2026). https://doi.org/10.1038/s41593-026-02433-7

- Received:
- Accepted:
- Published:
- Version of record:
- DOI: https://doi.org/10.1038/s41593-026-02433-7