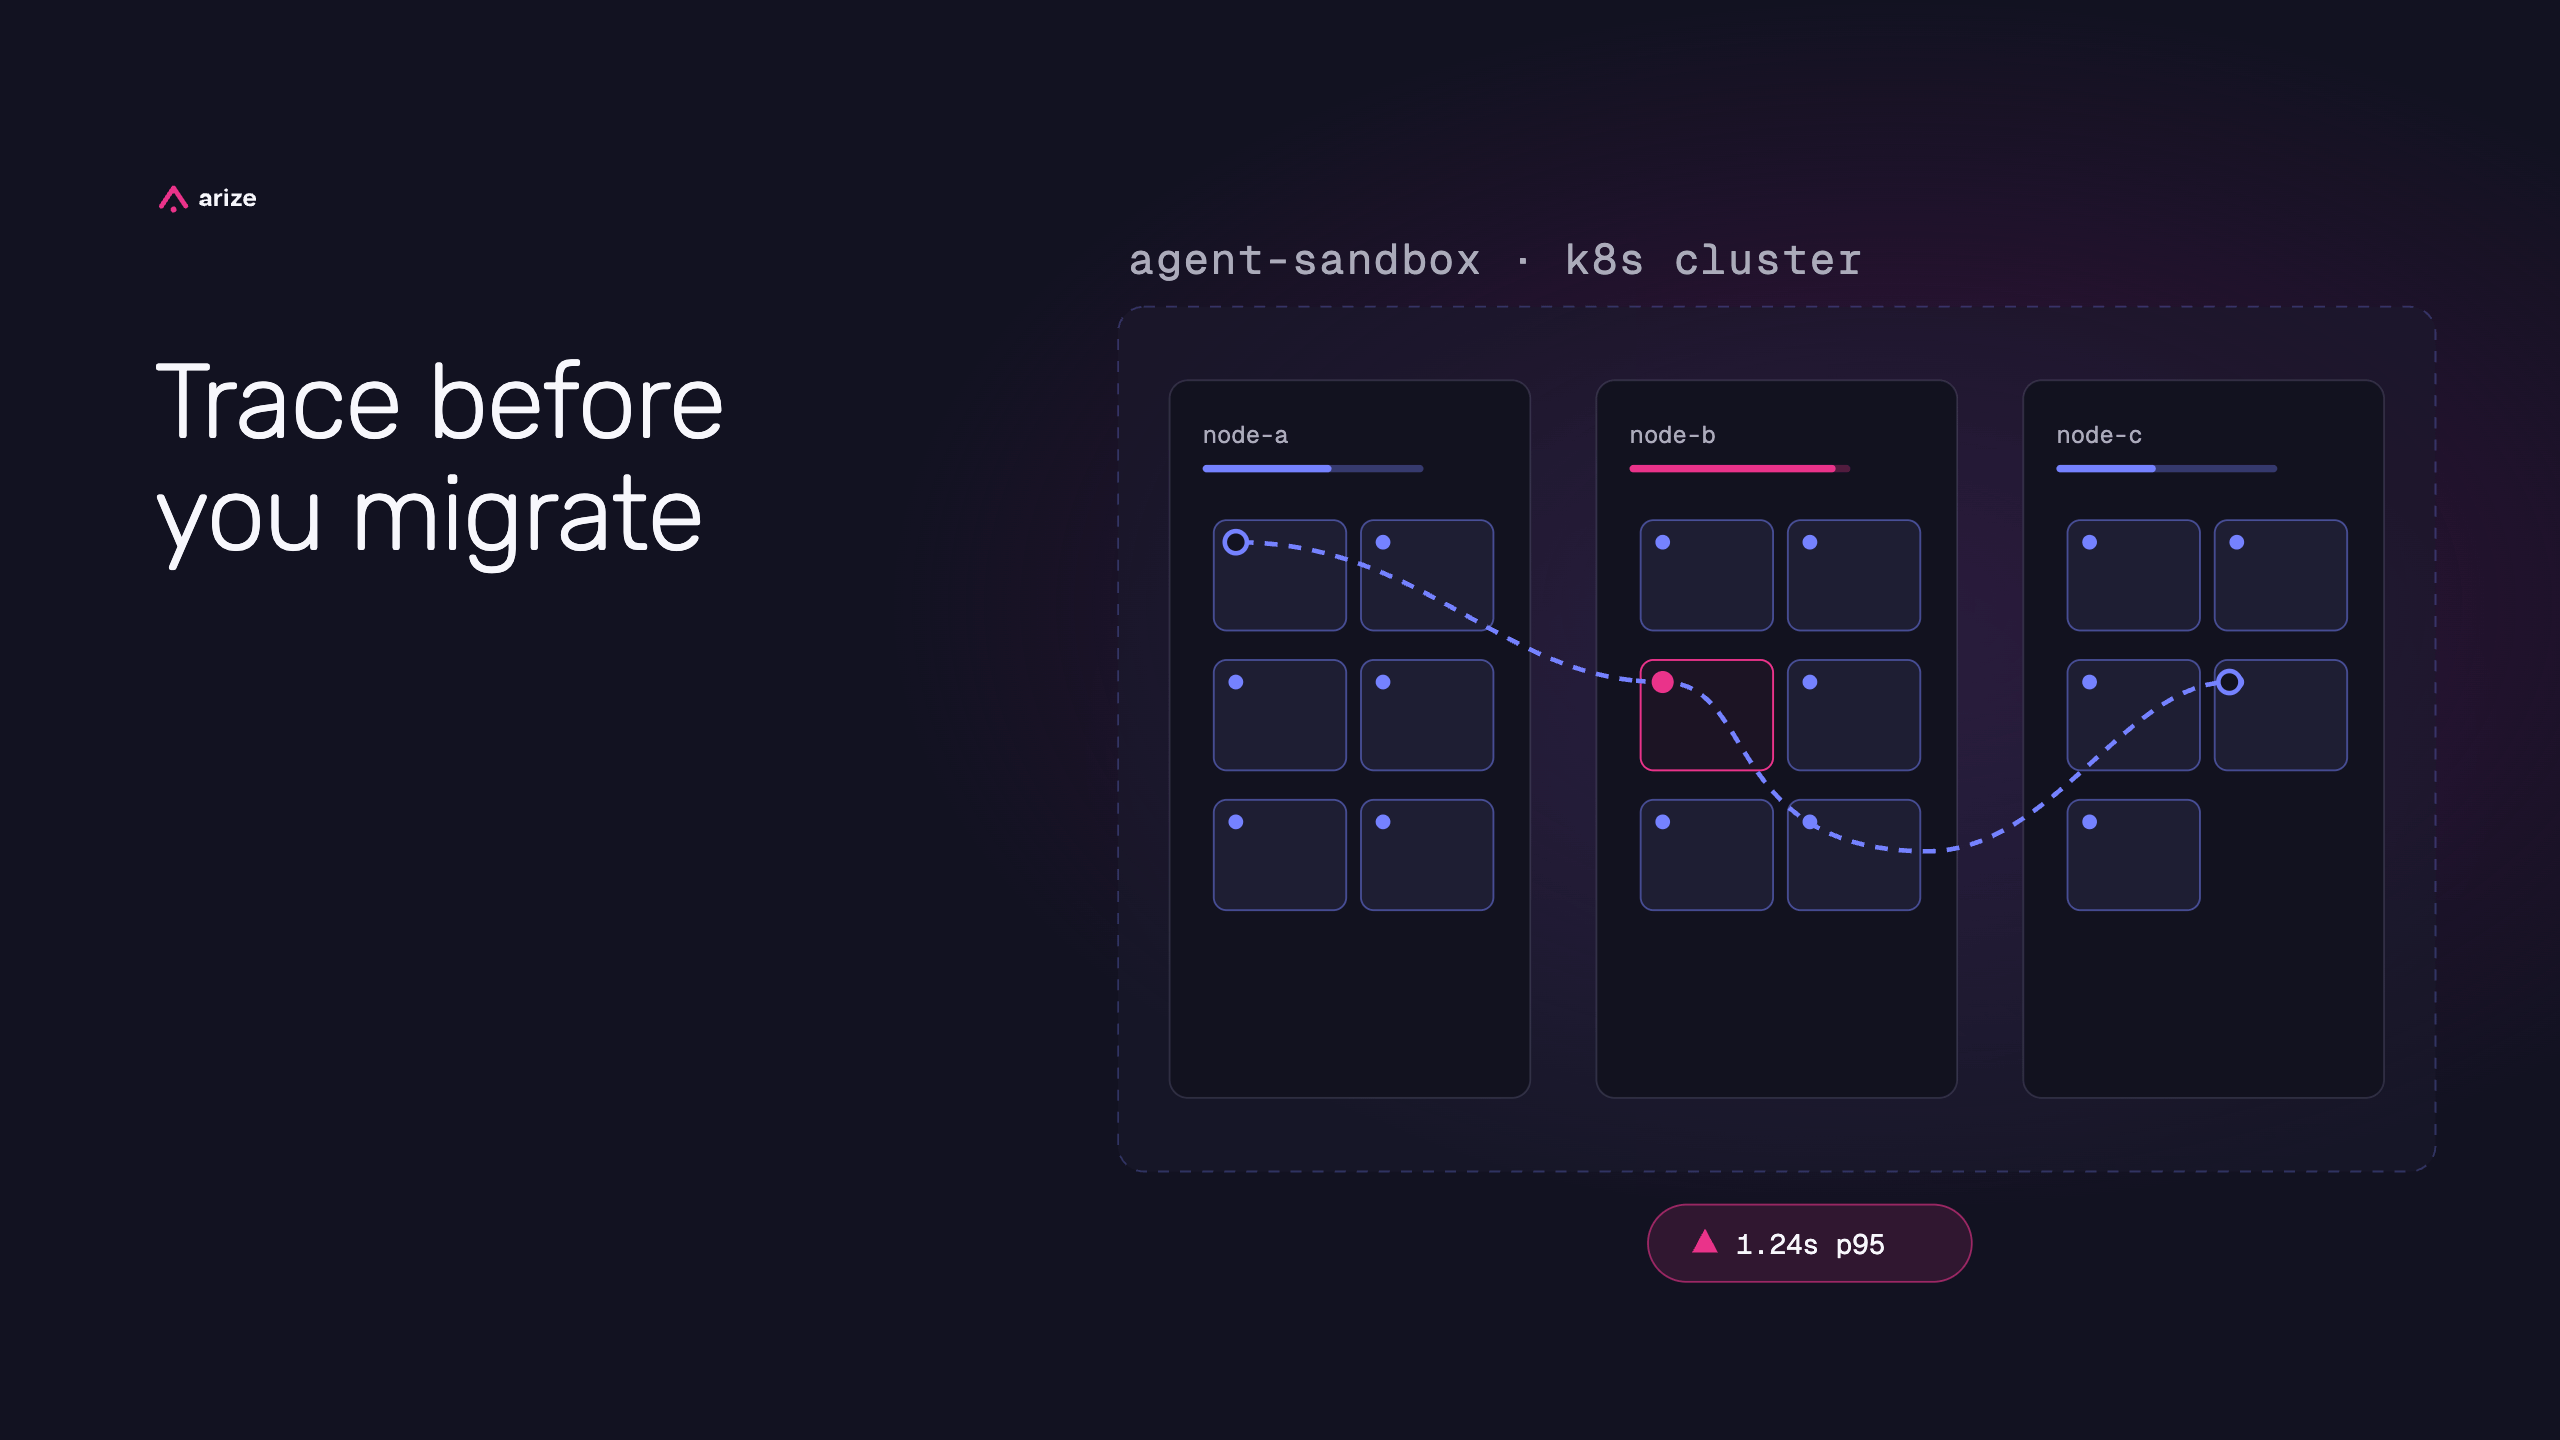
Your agent does more than call a model. It asks for files, shells out, installs packages, writes state, retries failed commands, and sometimes needs a fresh machine before it can do any real work. Most teams trace the model call; far fewer trace the environment that makes the tool call possible.
That gap is what makes the Kubernetes debate misleading. A pod may be the right way to run a service or a control plane, but a short-lived agent sandbox has a different job: start fast, isolate execution, keep run-local state, run commands with low latency, and disappear when the task is done.
Before you replace your runtime, instrument it. Treat sandbox creation, readiness, command execution, filesystem I/O, permission failures, and eval scoring as spans in the agent trajectory. Trace those first, and you can tell whether Kubernetes is the real bottleneck—or whether the problem is model latency, tool selection, eval design, or the agent harness itself.
Why agent sandbox requirements keep outpacing your cluster
“Sandbox” still means different things to different teams because agent workloads have moved faster than most platform defaults.
The requirements changed because the workload changed. A simple data-analysis agent may only need a Python process and temporary files. A coding agent needs a real repository checkout, package managers, shell access, and a filesystem that survives for the duration of the task. An eval or RL workload may need thousands of isolated runs where a few seconds of startup time compounds into hours of infrastructure overhead. A computer-use or desktop agent may need an interactive environment rather than a stateless container.
These are not all the same sandbox. Treating them as one pod template hides the differences that matter most: startup time, isolation boundary, local state, dependency setup, network policy, and teardown behavior.
Each wave raises the bar on isolation, state, and performance. The traces and evals you build on top of that runtime are only as trustworthy as the environment they execute in.
At Arize Observe 2026, Ivan Burazin, founder and CEO of Daytona, made the same point from the infrastructure side: teams keep reaching for Kubernetes when they need isolation, but the job description for an agent sandbox has outgrown what most pod templates were designed for. Daytona itself runs its control plane on Kubernetes. The question is not whether Kubernetes belongs in the stack, but whether it should be the execution layer for each agent run.
Runtime infrastructure is part of the harness
If the harness decides what the agent can do, the runtime decides where those actions actually happen. That means runtime failures are harness failures from the user’s point of view. A tool call that waits on a sandbox, a package install that stalls on network storage, a credential that leaks into the wrong environment, or a retry loop caused by a missing dependency all show up as agent behavior. These are the same class of issues covered in common AI agent failures. This is why the runtime belongs in the trace — the same principle as agent observability for model and tool spans. The model did not “take 45 seconds to answer” if 30 seconds went to provisioning and 10 seconds went to dependency installation. Without runtime spans, that distinction disappears.
When Kubernetes is the wrong layer for agent execution
Kubernetes excels at stateless services, rolling updates, and declarative scaling. Ask a platform team for isolation and you may get a pod spec before anyone writes down what the agent needs to do.
For agent sandboxes, the friction is often structural. Pod lifecycles pull images, run init hooks, and mount storage before your workload starts. Many agent workloads want dependencies and working-directory changes on fast local disk for the lifetime of the run, not on network-attached volumes when those add latency to package installs and file writes. That architectural gap is why purpose-built sandbox schedulers exist. Daytona’s Observe 2026 talk is useful as an example, not as a universal benchmark. Their reported numbers point in the direction many teams see in practice: cold starts, pod churn, scheduling delays, and storage topology can compound across long agent trajectories. But the exact gap will depend on image cache state, node pool configuration, region, workload shape, and whether runs are cold, warm, or bursty.
Treat those numbers as a prompt to instrument your own stack, not as a reason to migrate blindly.
What to measure in your traces
If you are debating Kubernetes against a purpose-built sandbox, start with production or staging traces rather than vendor benchmarks. Instrument the runtime the same way you instrument the model: as spans inside the agent trajectory.
Sandbox creation and provisioning. How long from the agent requesting an environment to the first tool call succeeding? If this span dominates, prompt tuning will not help. Compare cold start, warm start, and queue time separately.Sandbox teardown. How long from the final tool call to the sandbox being terminated and cleaned up? For sub-minute runs, termination grace periods,preStop
hooks, log export, and ephemeral volume cleanup can become part of the per-run cost.Tool execution latency. Once the sandbox exists, how long do shell commands, file writes, and package installs take? A slowpip install
ornpm ci
inside the environment looks like agent slowness in a dashboard that only tracks LLM latency.Filesystem and I/O behavior. Do agents stall on large reads, compiles, or dependency installs? Your traces should show whether file-heavy steps cluster at specific spans, and whether storage topology is the culprit.Permission and isolation failures. Did the agent run on the host instead of inside the sandbox? Did a tool call fail because credentials were visible or a firewall blocked outbound access? These show up as error spans or retried tool calls, not model errors.Eval latency. When eval batches queue behind pod scheduling, eval results measure infrastructure backlog rather than model quality. Track time from eval trigger to score written back to the trace.Trajectory time end to end. Fulltrajectory timematters here: a correct final answer that took three times longer because of provisioning or retry loops is a different failure mode than a wrong answer. Measure the full path the agent took, not just token generation.
In Arize AX and Phoenix, these map to span-level attributes on tool calls, environment lifecycle events, and eval results attached to traces. An evaluation harness depends on that same runtime clarity. That is how you separate infrastructure drag from harness bugs from model quality issues on the same dashboard.
How to choose runtime infrastructure without guessing
Keep Kubernetes for the control plane and long-lived services if that fits your stack. Rethink it as the default agent runtime when your harness spawns isolated work with sub-minute lifetimes, heavy local state, and burst concurrency.
A practical sequence we recommend:
Trace a representative workload before changing infrastructure. Capture sandbox creation, tool calls, and eval spans on real agent trajectories.Map your agent generation to the runtime you have now. Short code snippets, coding agents, RL fleets, and desktop knowledge-work agents have different requirements.Treat the sandbox as part of the harness so permissions, tool policies, andevaluation fundamentalsmatch where code actually executes.Re-run evals after any runtime change so you are comparing behavior, not just wall-clock time on a different substrate.
If traces show provisioning and I/O dominate, purpose-built sandboxes deserve a serious look. If traces show model latency, tool selection, or eval design dominate, swapping runtimes will not fix the problem. Kubernetes vs agent sandboxes
Kubernetes belongs in many agent stacks. It may run the control plane, host long-lived services, or provide a managed substrate behind a sandbox provider. But short-lived agent execution is a different layer, and it should be measured on its own terms.
Before you switch runtimes, trace the one you have. Measure sandbox creation, readiness, tool execution, filesystem latency, permission failures, eval queue time, and end-to-end trajectory cost. Then compare those spans with model latency and output quality.
If provisioning and I/O dominate the trace, purpose-built sandboxes deserve a serious look. If model latency, tool selection, retries, or eval design dominate, changing infrastructure will not fix the agent. The goal is to make the runtime observable enough that the trace tells you what to improve next.