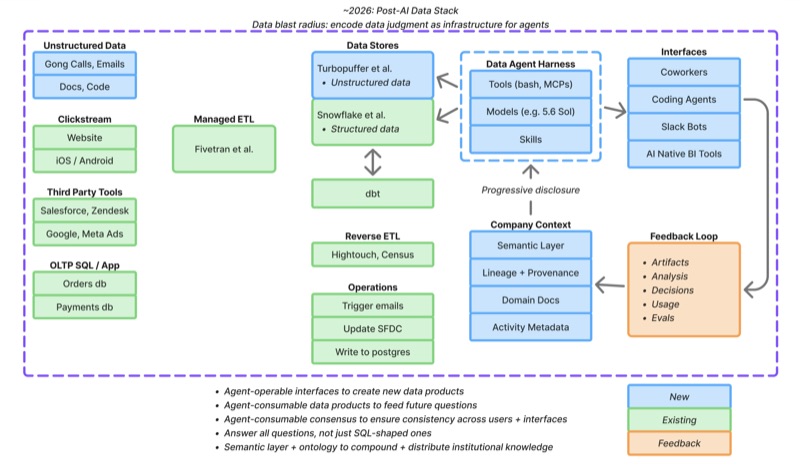
Every step in the evolution of data stacks expanded the blast radius of a data scientist. Here’s what I’ve seen so far, and here’s where we’re going in the post-AI era.
Overview #
- The pre-modern data stack (~2013) limited a data scientist’s perspective (data moats, small data, structured data).
- The transition to cloud data warehouses (~2016) expanded their scope to “ALL company data.”
- The rise of the Modern Data Stack + Reverse ETL (~2020) turned data scientists from reporters into operators.
Each technological shift expanded what a data team could build and accomplish. Today (~2026), we have entered the era of the “Post-AI Data Stack”. AI makes producing analysis cheap. It does not make agreeing on reality cheap. Today’s data teams have two jobs:
- Enable everyone to build with data and AI: accurately, powerfully, independently.
- Build and champion the singular reality their company operates on.
Coding agents, AI-native vendors, and Slackbot analysts have made it easy for anyone to answer their own questions and generate their own narratives. As data questions get more personalized and dashboard building gets cheaper, the scarce resource becomes company-wide consensus. The post-AI data stack allows data teams to encode expert judgement into the infrastructure that allows agents to produce correct analysis without the data scientist in the room.
This shift yet again expands the blast radius of a data scientist: from a “producer of analysis” to the builder of a company’s reality on what’s true, what matters, and why.
Pre-Modern Data Stack #
I’m positive database technology improved quite a bit from 1970 to 2013, but I wasn’t in the workforce yet. My career started at the tail end of the on-prem era. At Wayfair in 2013, business intelligence ran on top of SQL Server 2012 databases hosted in Waltham, MA. Every once in a while a DBA would drive 30 minutes down I-90 to add more servers or install an upgrade. Seriously! Wayfair’s tech blog still has a great 2012 article on Lessons from a Datacenter Move.
Even Steve Conine, one of our co-founders, did an overnight stint at the datacenter helping with the physical move of servers.
There were three brutal sources of friction:
Data moats: All of Wayfair’s data couldn’t fit on the same database. Querying across databases didn’t work without a ton of massaging (linked server calls took forever, often failed, didn’t benefit from query optimization, and required handholding from DBAs to even access).Web analytics: Earlier SQL dialects couldn’t handle semi-structuredVARIANT
/JSON
objects and all the functions that go with them. Web traffic is the core of product analytics, and it’s almost always represented as JSON. Functionally, you couldn’t answer web analytics questions.Big data: Somewhere between 10m and 100m rows, your analysis ground to a halt (and took everyone else’s queries down with it). SQL Server 2012 ran on one node, had no ability to scale compute or storage, and was built for fast row-level updates, not column-level aggregations.
I worked on pricing and recommendation algorithms; we frequently ran experiments to estimate customer price elasticity. An extremely reasonable question to ask: is a customer’s card issuer a meaningful predictor of willingness-to-pay? Are BIN 3717 (AMEX Platinum) customers less price sensitive?
At Wayfair’s scale, this analysis was impossible. Payments data was on a different physical database than the order data. We didn’t have a semi-structured database, so we didn’t store clickstream, or even log it. And even if we had, querying the product pageviews from one Cyber Monday (100m+) would have failed, and taken down the rest of the reporting with it.
Databases in 2013 limited analysis to datasets stored on one server, that weren’t too big, and were in the right shape.
Cloud Data Warehouse #
This vacuum led to the meteoric and well-documented rise of Snowflake / Redshift / GCP. These tools solved three problems an on-prem OLTP SQL Server never could:
- They scaled storage infinitely, taking “all of a company’s data in one place” from a pipe dream to a solved problem.
- They scaled compute infinitely and horizontally, so a data scientist could analyze 100m+ Cyber Monday rows using separate resources from the queries powering critical financial reports.
- They read semi-structured data natively, so web traffic became accessible, and funnel analytics became mainstream.
A great data scientist tells their business what matters most. That’s only possible if they can use all of the data.
Modern Data Stack #
The next step on the timeline is ~2020: the also-well-documented rise of ETL, Reverse ETL, and the Modern Data Stack. I’ll skip describing the technology and talk more about what it felt like.
When Wayfair rolled out Hadoop as a big data solution, it took a Cloudera implementation team on their end, three data engineers on our end, and four months to get up and running. The tool itself required learning a new language, aggressively managing Java virtual machines, and one big query could break it for everyone else (this happened all the time).
Compare that to the 2020 magic of the Modern Data Stack. If you were a CTO at a company with a Postgres database, a few SaaS apps, and product-market fit; you could hire a head of data, give them a credit card and API creds, and legitimately expect them to have reporting spun up by lunch. They just needed to know SQL.
ETL wasn’t a new concept, but (going back to friction), getting new data had always required begging eng to build pipelines. That a data scientist could just… have LinkedIn Ads data next to Zendesk data next to app data next to payments data expanded their scope yet again. This was especially true of “nice-to-have” analyses, joining across seemingly unrelated data sets: surfacing that customers who come in from “No Founder Credit Checks” ads on Meta have worse credit losses, or that referred customers file fewer Zendesk tickets. Data teams can’t beg eng teams to build ETL for “nice-to-have” data. Managed ETL let them add data by clicking a button in Fivetran, and paying at the end of the month.
ETL expanded what a data scientist could see, Reverse ETL expanded what they could do. Going back to the question of AMEX price sensitivity: previously, the conclusion of that work (“AMEX customers are X% less price sensitive”) would have been a slide in a presentation, with a hope that someone else picked up a follow-through that looked somewhat like the original insight. Reverse ETL moved data science from reporting to operating: all of a sudden data scientists could trigger lifecycle emails in Iterable, update customer segments in Salesforce, change how the core product looks and feels.
Post-AI Data Stack #
Which brings us to today. The shape of the post-AI data stack is starting to show. Here are the requirements I’m seeing, how infrastructure is evolving to meet them, and a bit on what we’ve built at Ramp.
Agent-Readable Artifacts
Humans are no longer the primary consumer of data team outputs, and dashboards + analyses are no longer the end products. Data team outputs are now consumed by agentic interfaces, and repackaged by LLMs for human eyeballs and decisions. The dashboard stops being a destination you link to in sprint planning, and starts being a repository of facts, contracts, and explanations that agents can decompose and reassemble.
Saturday Night Live has evolved analogously. The main thing used to be the main thing: you listened to full podcasts, you watched SNL, you opened a bookmarked Looker dashboard every Monday. You opted in. Today the primary unit of SNL shows up passively on a feed: full skits on YouTube, subsets of skits on TikTok. People find podcasts through clips reviewed by LLMs and surfaced by algorithms, maybe never watching the original. SNL has reinvented itself to be broken up and reassembled by agents and algorithms.
By 2027, your CPO will learn about your team’s product launch through a subagent, deployed by an agent, that scans every product launch dashboard once a week. Marketers obsess over AEO/SEO, X thought leaders hack recommendation algorithms, data scientists will learn to do the same. This requires building data products legible to LLMs, the same way websites optimize for Google. What that looks like:
- Declaring a dashboard’s raw code, filters, owners, entry points, folder structure, visualizations, and rendered values in a format designed for LLM consumption: per-data-product
llms.txt
that renders in markdown. - Provenance instructions on how to go deeper, how the dashboard queries relate to other data models and code, or how they relate to the business: projects, org charts, product roadmaps, company goals.
SEO is hard, because Google’s algorithm is a black box you don’t control. Internal data teams have the luxury of building LLM-readable data outputs, AND the company-wide agent that consumes them. We designed Ramp’s internal BI tool and @Research
agent hand-in-hand. A dashboard is represented in a React interface for people, and for agents: markdown descriptors, fetchable SQL, and cached values as .csv
s. The Research harness is explicitly taught how to retrieve all of these those products, and how they fit in with the rest of the codebase.
This is the data equivalent of chopping SNL clips for TikTok. If you design data artifacts to be machine readable and ready for decomposition and reassembly by agents, you ensure your work shows up to drive decisions. It’s your job to be the reason an agent surfaces the right data for the right question.
Make sure your answer shows up when your CPO asks their agent to ask their subagent how the product launch went.
Agent-Operable Tools
Sales teams spend meaningful fractions of their life in Salesforce, I’ve spent a regrettable meaningful fraction of the last five years in Looker. For a company to truly adopt a data tool, your junior data scientists must be excited to use that tool for hours every day. If you force your team to use a clunky UI in 2026, they will quit.
No data scientist wants to click around web UIs, and this will soon be true for all business stakeholders. OpenAI and Anthropic Chrome extensions are still slow and buggy: teams won’t automate the clicks they used to make. Instead, teams will push work down the stack until they hit something agents can operate on directly with code, and stop using vendors that aren’t agent-operable. This is obvious at renewal time: it’s easy to churn off a BI tool when the data team stops building in it, and the finance team stops relying on it. Equivalently, teams won’t consider new vendors that don’t expose APIs / MCPs as a first-class operating system, or lock you into a UI-first interface + workflow.
i really don’t want to use your agent, i want to use my agent to use your thing.—[@ASpittel]
Your stack must be operable by an agent. In fact, it must be operable by ANY agent.
Agent-Agnostic Context
Agent-operable tools must fit into existing workflows and connect with everything else a data team and company touches. There’s a new cohort of post-AI tools that want to be an end-to-end solution, and want you to use their agent. All you have to do is…
- Write your entire semantic layer and business context in their tool’s proprietary language.
- Keep all of your models, dashboards, and analyses in their tool (and their tool only).
- Send all of your business stakeholders to their tool (and their tool only).
- Let them leverage user activity to improve their understanding of your data and company.
This makes sense for a vendor hoping to become indispensable, but it’s a very silly thing to do. But the tools that get adopted will be the ones capable of plugging into platform-agnostic workflows, connected to all of the context and tools the data scientist has access to. If an agent can only work in one tool, it’s not a helpful agent. That forces a data team into a call:
- Pick one vendor and put all of the context and users of your business into their tool, locking you into a bet on the future of that vendor and interface.
Or:
- Make your context and connectors as headless as possible, and do your best to ensure that whether someone is using a coworker, a coding agent, a BI tool, or a Slack bot, your data question gets the same answer.
Don’t lock your intelligence into someone else’s interface. Models, harnesses, and interfaces are moving fast enough that whatever user preferences your company has now will look different in a quarter. So the question becomes: how do you ensure consistency across interfaces?
Agent-Testable Consensus
Pre-AI, data teams created consensus through organization and scarcity. Dashboards were organized in nested folders that matched the org chart. If you wanted to know how a company worked, you started by looking through a folder structure. And creating dashboards took a long time! Business stakeholders bemoaned long delays for basic insights on a product launch. Meanwhile, data teams needed to ship instrumentation, ETL pipelines, dbt models, and LookML PRs, before they painstakingly handcrafted dashboards, constructed click by click.
The hierarchy of the BI tool implicitly conveyed everything the company cared about enough to both build and maintain a dashboard on. Today, the bottleneck for data work is no longer writing code and making dashboards, and humans don’t navigate data products by clicking through UI folder structures. It’s easier than ever for a product-domain-expert data scientist to run an analysis and spin up a dashboard about an area they understand deeply — but it’s also just as easy for everyone else. Every person can ask a slightly different question, look at a different slice of customer, use a different metric definition, end up with a different number, and draw a different conclusion.
The scarce resource is consensus. Consensus sounds like a vague term, but it can be engineered, asserted and measured.
Here’s the initial test / iteration loop:
- Take all the metrics from last quarter’s board deck
- Ask a question about each metric (e.g. “How many active customers?”) via every interface x model combination your company uses (coding agent, coworkers, BI vendors, etc.)
- Count how many distinct answers come back
- If
=1
, celebrate. If>1
, read every trace to figure out the discrepancy, ship fixes, and repeat from #2
You’ve achieved consensus when interface choice doesn’t change the answer or the process.
This is how Ramp’s internal research harness works. We test user questions across interface + model variations, and flag when traces differ. It’s less a test of which model x interface works best, and more a test of whether our instructions are clear enough that ANY model x interface gets the same answer. Assume the models are never wrong, your context is just underspecified. We track “consensus divergence rate” as the share of questions whose answer or trace differs depending on where it was asked, and what model was used. For board materials and anything your C-Suite looks at weekly, consenus divergence rate should be zero.
You get there by compounding context through evals.
results = ask_everywhere(
    interfaces=["coworker", "coding_agent", "bi", "slack"],
    question="What was net revenue retention last quarter?",
)

assert same_metric_definition(results)
assert values_within_tolerance(results, relative=0.00001)
assert same_authorization_outcome(results)
assert required_evidence_used(results)
Compounding Improvements
When we built Ramp Research, we first focused on if the models returned the right answer. Reading the traces ended up being far more helpful than looking at the outputs. Correct runs found the relevant domain docs, incorrect runs often skipped the doc, picked the wrong table, used the wrong metric and filter. Failure traces gave us confidence to force the research harness to read a domain doc before analysis. It also gave me the mandate to carve out an afternoon for the data team to write comphensive docs + evals, and consider both a part of the job responsibility going forward. Evals are the lens through which you observe whether the right context and tools were actually used, and whether using them produced the right result. By forcing the data team to write docs, and the agent to read them, we improved every future research question running through our harness.
Our data evals now test both the final answer, and the evidence behind it. The answer can be the output of a canonical SQL query, or anything else verifiably and deterministically true. The evidence specifies the path we trust: reading the relevant domain doc, using a particular semantic view, navigating to a canonical dashboard, inspecting the results. A correct number reached through an imperfect process is not as valuable (and is way more likely to break with the next model release) than a correct number produced by a blessed path.
To make that measurable, we normalize traces (e.g. READ_DOMAIN_DOC
, VIEW_DASHBOARD
, READ_SEMANTIC_VIEW
, EXECUTE_SQL
, SYNTHESIZE_ANSWER
) and snapshot the surrounding system alongside every run: model, prompt, tools, code, evaluation corpus, and hashes of the knowledge available at the time. When an eval fails, the repair requires a deep understanding of the model + agent harness, but also company-specific intuition. Was the domain context ambiguous? Was the data model incomplete, or defined in code outside of the agent’s purview? Did the user have the access they needed? New models come out so frequently that it’s easy to hope that the next frontier will solve your problems, but creating and burning down a “failure taxonomy” of evals is how you make progress, not by burning frontier tokens against a harness with missing context.
Most of our evals execute in SQL, but the post-AI data stack is bigger.
Beyond SQL
Data stakeholders with years of suffering through Looker and Tableau UIs have developed an intuition for what a “SQL-shaped question” looks like. BI tools run on Snowflake under the hood, Snowflake is SQL, and SQL is great at numbers: aggregating, filtering, grouping. SQL is not at all the right tool for answering “Check Gong calls, why are we losing deals in the construction vertical?” or even “What’s the Travel pod’s north star metric?”
As companies move to chat- and agent-first workflows to engage with data, you will increasingly see stakeholders ask every shape of question. Don’t train stakeholders to limit themselves to SQL-shaped questions: instead, set up your stack to answer structured and unstructured questions flexibly, through the same entry point.
This is possible, but it requires some design in advance. It’s trivial, cheap, and fast to aggregate 100m+ rows in a raw transaction table in Snowflake, it is non-trivial, expensive, and slow to to parse 100k raw Gong call transcripts via LLM.
The fix we’ve adopted looks a lot like pre-modeling data, but for meaning instead of shape. We run an AI tagger over the entire unstructured dataset, once, offline, and write the output back with structure we observe from the questions people ask. For Gong calls, we track loss_reason
, objection_type
, mentioned_competitor
, the same way a card transaction data model has normalized vendor and merchant category columns that any future analysis can GROUP BY
. You learn how to parse unstructured data by observing the types of questions people ask, then making that ask cheaper and extensible for future questions.
We solved this problem the expensive way first, by implementing a vendor that processed Gong calls and email for every opportunity, and wrote free-text fields back into Salesforce. At one point, the vendor’s tagging distribution shifted with no warning, in a way they couldn’t explain, debug, or revert. We couldn’t reproduce or update critical win/loss rate reporting. This is what happens if you delegate compounding your sales intelligence to a vendor. Best case, you don’t own it. Worse case, they break it, and you can’t fix it.
Parsing sales calls now runs as a versioned prompt on our infrastructure. We have an practioner-defined taxonomy that improves with every error, updates with every product launch, and we review sales team questions to figure out which fields to promote into the shared model next. Every update is compunding intelligence.
Why Semantic Layers Are Mainstream Now #
Over the few months, Ramp’s founders, CFO, and Head of IR have spoken about how important our well-modeled data layer is for leveraging AI internally. What a compliment! So much of the craft of dbt, analytics engineering, and Kimball modeling is about naming business concepts correctly, at the right grain, the first time, and what goes wrong if you mess it up. It’s fun to see other teams care about how the SQL sausage is made.
But frankly, if you’d told me two years ago “your CEO will bring up Ramp’s semantic layer on podcasts, your IR team will bring it up on investor calls,” I would have been shocked. Semantic layer opinions are supposed to be for post-conference cocktails after Snowflake Summit, and spicy comment sections on dbt Coalesce videos.
There are two reasons semantic layers have cracked the consciousness of the C-suite.
First: companies without data teams and Snowflake/Fivetran bills (the vast majority) start their AI journey by plugging coworking tools and agents directly into their vendors. This skips the ETL and data modeling step. It lets individuals work fast, but it leads to reproducibility crises, where nothing is consistent across the org. This is why the first step of nearly every Applied AI solutions pitch is a forward-deployed team building a semantic layer that describes your business.
Second: as Satya wrote in The Reverse Information Paradox, there is value in “intellgence exhaust”, every “Hey, this looks off,” every metric clarification. Either context compounds within your four walls, or within someone else’s. A company’s semantic layer and the ontology sitting on top are the guts of internal AI productivity: every correction a data scientist makes is accumulated learning, which only compounds if you build the infrastructure to catch the error, trace the process, and distribute the fix to your entire company.
This is the best argument against connecting agentic vendors directly to your raw data without a semantic layer in between. It’s not just that the answers might be wrong, it’s that every correction goes toward teaching the vendor about your business instead of fixing your own stack. That’s why the C-suite and the board care: if you’re going to spend mind-boggling and unprecedented amounts on tokens for internal productivity, you better make sure your company’s institutional knowledge compounds as your own asset, not training data for someone else.
A good semantic layer encodes all the tribal knowledge (“Actually, Card TPV excludes refunds after day 45,”, “The construction vertical mapping changed in Q2-2025”), every judgment call around a metric, every north star metric, drumbeat, and product pod, and pushes them into every system an employee touches, starting from their first day. This unlocks massive productivity gains at scale. Time-to-productive shrinks for new grad SWE interns, seasoned sales execs, and everyone in between. ICs learning a new product area don’t start from a blank slate, they inherit the judgment of everyone who came before. This is leverage, and the expanded job for a data team in the post-AI era: make every future question, agent, and hire start smarter than the one before.
The Job Today #
The data science lifecycle looks something like this:
Reality → Data Capture → Context/Modeling → Analysis → Consensus → Decision/Action
Each era removed one constraint and created a new scarce resource. The cloud data warehouse era let a data scientist store and compute across all of a company’s data. The modern data stack era turned data teams into operators.
The post-AI era reduces the cost to build a dashboard or ask a data question to near-zero. As data output becomes abundant, data analysis becomes commoditized. The scarce resource is now consensus. Pre-AI, consensus emerged through scarcity (expsensive handcrafted dashboards, nested in org chart folders). Post-AI, consensus is something you engineer.
The test of a great data scientist is no longer their ability to conduct one analysis exceptionally well. It’s their ability to scale their knowledge by encoding their judgment into infrastructure, such that every future agent, decision, and employee begins from the data scientist’s representation of what’s true, what matters, and why. Decisions in 2027 will be made by execs who “read the dashboard” without ever opening it, the same way millions of people watch an SNL sketch without watching Saturday Night Live. We cannot predict exactly how the data product will be found, cut, recombined, and delivered. We don’t even know what interface the user will be in. The job of the post-AI data scientist is to make sure the meaning survives the edit.