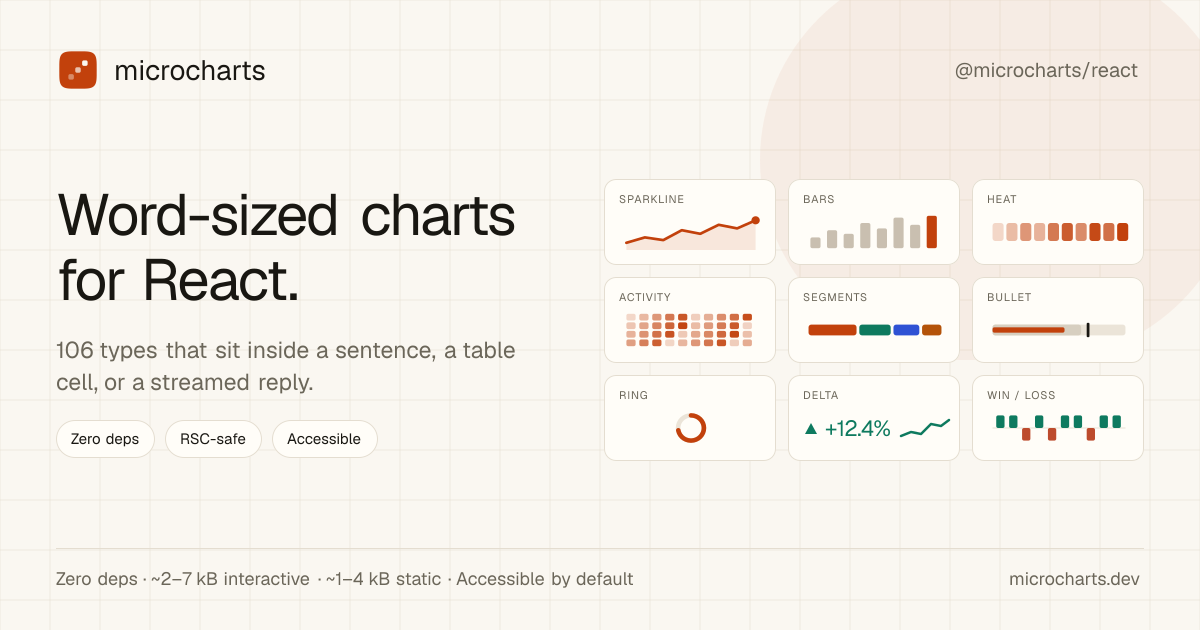
Word-sized React charts. 106 types that fit inside a sentence, a table cell, or a streamed reply.
pnpm add @microcharts/react
live · Gemini Nano in your Chrome · numbers are illustrative
Charts a model can type #
Every chart reads the same way: data
alone renders something correct, and a prop like domain
or color
means the same thing everywhere. Once a model has seen one of these, it can write the other 105.
an agent writes
<Sparkline
  title="Weekly revenue"
  data={[132, 148, 141, 165, 159, 182, 176, 203]}
  curve="smooth"
/>
a person gets
106 chart types, each the size of a word #
hover a tile, they’re live
What we left out
Pie, gauges and a few other familiar shapes don’t survive at word size. Each one has a replacement here that answers the same question and stays legible.
pieSegmentedBarneedle gaugeBulletviolinMicroBoxbatteryProgresswaffleIconArray
They sit where your text already is #
Both mockups below are rendered live from the library, down to the sparkline inside the table cell.
Revenue held its climb into Q3.
| Region | Trend |
|---|---|
| EU | |
| US |
Deploys are healthy this week and error budget is holding.
Charts arrive as plain text #
A streamed reply is ordinary text until a chart fence closes; at that moment the block becomes the shipped component. Works with any of the 37 tools below, and anything else that writes text.
- Claude
- ChatGPT
- Gemini
- Grok
DeepSeek · Kimi · Meta AI · Mistral · Perplexity · Qwen · Poe
- Cursor
- Claude Code
- Codex
- v0
- opencode
- Antigravity
Windsurf · Zed · Cline · Replit · Continue · Warp · Amp · Roo Code · StackBlitz · JetBrains AI · Pi · Copilot
- Vercel AI SDK
- OpenAI Agents
- LangChain
- Anthropic SDK
Hugging Face · Ollama · Pydantic AI · CrewAI
Docs a model can read whole
curl microcharts.dev/llms.txt→ the library, summarized for a model's context window
curl microcharts.dev/llms-full.txt→ every doc page, one file, ready to paste into a system prompt
curl microcharts.dev/catalog.json→ all types with props and data shapes, machine-readable
curl microcharts.dev/agent-setup.md→ the whole setup as one prompt: install, conventions, first chart
npx -y @microcharts/mcp→ find_microchart · get_microchart · render_microchart, finished SVGs for surfaces that can’t run React
Bad data degrades, it doesn’t crash
[NaN, 3, Infinity]
“Single value 3.”[]
“No data.”[7]
“Single value 7.”[-4, -4]
“Flat at -4.”
A model mid-reply will sometimes emit NaN, Infinity, or an empty array. Each case renders something sensible, with no try/catch on this page.
Screen readers get a real sentence #
A chart’s accessible name is a sentence generated from its data, on by default. You don’t write alt text and it can’t go stale, because it comes from the same numbers the chart draws.
- “Trending up 27%. Range 128 to 163. Last value 163.”
- “Trending up 75%. Range 2 to 9. Last value 7.”
Named by its data
Charts are role="img", named by the generated sentence, so the caption can never drift from the numbers.
Keyboard, one tab stop
Interactive charts take a single focus; arrows rove the units, Enter pins the readout so it survives blur.
Announced politely
Each change of the active or selected unit is written to a polite live region, throttled so a stream never spams.
Never color alone
Direction and state are doubled by glyph and position, and strokes clear a 4.5:1 contrast target by default.
System preferences, handled
prefers-reduced-motion, forced-colors, and prefers-contrast all work without any setup on your side.
2.17–6.75 kB per interactive chart, enforced in CI #
Recharts is a full charting toolkit, and its bill is fair for what it carries: one tree-shaken LineChart still costs about 106 kB gzip and 11 dependencies, because the shared kernel comes along. On a page that is mostly chart, that’s fine. Inside a sentence or a table cell, it’s most of your budget.
microcharts covers the other job: you already know the shape of the answer and just need the mark, small enough to live in the interface.
what it costs to draw one chart, to scale
Both bars share one scale. Tree-shaking drops Recharts’ unused chart types, but a single LineChart still ships the shared Redux/d3 kernel; a microcharts subpath is just the inlined mark, static from 1 kB.
recharts 3.9.2 one-chart: esbuild tree-shake, 2026-07 · package 145 kB via bundlephobia · microcharts interactive median from .size-limit.json, CI-enforced
2.17–6.75 kB
gzip per interactive chart
median 5.07 kB · static 1–4.07 kB (median 2.64)
0
runtime dependencies
dependencies: {}
forever; React is a peer
0 kB
client JS for static charts
pure SVG out of an RSC; nothing hydrates
The whole palette, from your one brand color #
defineTheme
derives a color-blind-safe palette and matched dark variants from one brand color. Pick a swatch: every chart re-themes through the same CSS custom properties your app would use, and positive stays green, negative stays vermillion.
defineTheme({ accent: "#c2410c" })
Seven real apps, all 106 charts #
We built 7 example apps with @microcharts/react
installed from npm, and between them they use every chart type in the catalog. Each card opens the live app, or you can walk through them as pages.
Start with a sparkline in a sentence #
pnpm add @microcharts/react