Some of the world's best forecasters have predicted the future by extending a trend they can measure. Here are more trends like that, and where they lead if they keep going. Green lines are still holding, amber lines are bending and red lines have broken. Under each graph you can change the years the line is fitted to, how far it is drawn, and the scale.
AI #
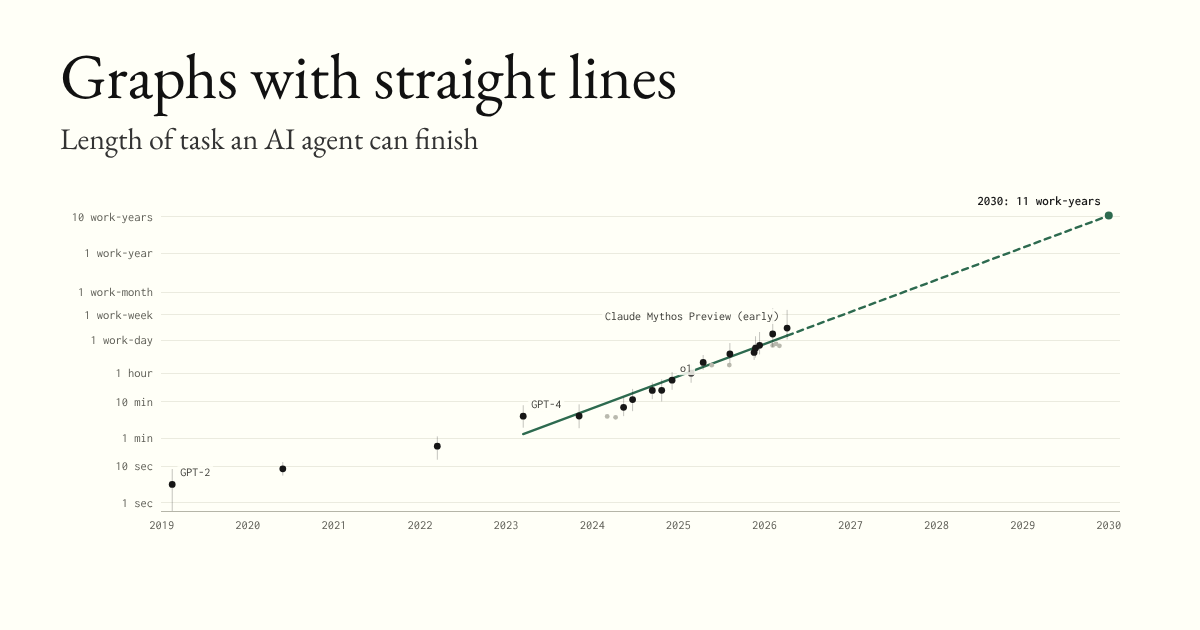
Length of task an AI agent can finish
The length of software tasks, measured by how long they take skilled people, that the best AI agent completes half the time. Since 2023 it doubles every 4.1 months (×7.6 a year). On this line agents handle a week-long task by November 2026, a month-long one by August 2027 and a year-long one by November 2028.
An agent that can work for a month without help could do most of what a software engineer does, including the work of building the next AI model, which is the step the AI 2027 scenario turns on. Fitted from 2019 instead, the line is slower and reaches a month-long task in September 2028. METR's tasks are self-contained and scored automatically, so the line may run ahead of messier real work.
Computation used to train the largest AI models
Measured in floating-point operations. Since 2010 the compute in the largest training runs doubles every 5.4 months (×4.6 a year). The line reaches 1.9×10²⁹ FLOP in 2030, about 210 times the largest run so far.
Epoch AI, which collects this data, estimated in 2024 that runs of that size are possible by 2030, with power the hardest limit. Such a run would draw gigawatts for months. The companies doing these runs now sign deals for their own nuclear and gas power.
Nvidia data center revenue, per quarter
Nvidia makes most of the chips that AI is trained and run on. Since 2016 this revenue doubles every 14 months (×1.8 a year), reaching $89 billion in the quarter to July 2026. The line says $503 billion a quarter in 2030.
That is $2 trillion a year, more than 1% of everything the world produces, spent on one company's chips. It needs Microsoft, Google, Amazon, Meta and a few others to keep raising their spending at the same pace. Between them they planned to spend about $700 billion on data centers in 2026.
OpenAI and Anthropic revenue, as a share of world GDP
The two companies' annualized revenue added together, as a share of the world's GDP. Since late 2023 it doubles every 5.9 months (×4.1 a year), to 0.079% of world GDP in July 2026. On the line it passes 1% of world GDP in July 2028 and the whole world economy in 2031.
Anthropic, in purple, has grown faster than OpenAI, in blue, and passed it in the spring of 2026. The line cannot reach 100%, because the companies' customers are part of the same economy. Long before that, either the growth slows or AI makes the whole economy grow far faster than its own line, which is the bet behind the money now going into data centers.
Epoch Capabilities Index
One score that combines dozens of AI benchmarks, scaled so that GPT-5 scores 150. The best model gains about 15 points a year, and the line reaches 200 in 2029.
Single benchmarks fill up within a year or two of release, as the next four graphs show, which makes it hard to tell whether progress is speeding up. Putting them on one scale fixes that. It rose slowly through 2023 and about twice as fast from the spring of 2024, when models that reason before answering arrived. The line is fitted to the whole period.
FrontierMath
Several hundred unpublished maths problems written by mathematicians, from advanced undergraduate to research level. The best score went from 19% at the start of 2025 to 94% in September 2026.
A logit scale turns an S-curve, which is how benchmark scores usually rise, into a straight line. On it this line passes 99% in July 2027. Mathematicians who saw the problems in 2024 expected them to hold out for years. A model that solves problems like these reliably can take over much of the routine work of mathematics, such as checking cases and proving lemmas.
SWE-bench Verified
500 real issues from open-source Python projects, mostly bug reports, each checked by people to make sure it can be solved. The best score went from 31% to 83% in eighteen months, and the line passes 95% in February 2027.
Fixing a described bug in someone else's code is a large part of a software engineer's job, and companies now hand this work to AI agents every day. OpenAI audited the set in 2026 and found that at least a sixth of the problems reject correct fixes, and that models had seen many of the answers in training. It stopped reporting scores, and this series ends in April 2026.
Humanity's Last Exam
2,500 questions written by experts in dozens of fields, chosen because the best models of late 2024 got them wrong. The best score went from under 10% then to 55% now, and the line passes 90% in January 2028.
The name was a bet that it would be the last exam of its kind worth writing. A 2025 review found that many of its chemistry and biology answers are probably wrong, so the top score that can be reached is below 100%. Questions with a single checkable answer are running out. What is left to measure is long, open-ended work, like the tasks in the first graph.
ARC-AGI-2
Visual puzzles that people find easy and that were built to be hard for AI. Every puzzle was solved by at least two people in testing. The best score went from almost nothing in early 2025 to 95% in September 2026.
The first ARC test stood for five years before a model passed it in late 2024. This one lasted about a year. Its makers have moved on to a third version made of interactive games.
Price of GPT-4-level AI
The price of the cheapest model that matches the original GPT-4 on hard science questions, in dollars per million tokens (about 750,000 words). It fell from $37.50 in March 2023 to $0.12 at the end of 2024. On the fitted line it falls 98% a year, halving every 2.2 months.
Each level of ability gets cheap within a year or two, so jobs that were too expensive to hand to AI when a model came out, like reading every document a company has, soon cost almost nothing. The price of the newest and most capable models has fallen much more slowly. Epoch's series ends in 2024.
Computers #
Transistors per microprocessor
The number has doubled about every two years since 1971, as Gordon Moore predicted in 1975. The line passes a trillion in 2030, which is also Intel's target for a single chip package.
Every gain in computing from the personal computer to AI rests on this line. It has held even though each transistor stopped getting faster (see the next graph) and a new chip factory now costs over $20 billion. Chips keep up by joining several pieces of silicon in one package. Nvidia's 2024 Blackwell chip is two pieces with 208 billion transistors between them.
Processor clock speed Broken
Clock speeds rose about 29% a year until 2004. The line went on to 120 GHz by 2021. Real processors stayed below 5 GHz.
Until then, smaller transistors used proportionally less power, so they could switch faster without the chip getting hotter. Around 2004 that stopped, because leaking current made faster chips too hot to cool. Intel cancelled its 4 GHz Pentium 4 that year and moved to chips with two cores. Since then chips have added cores instead of speed, and a program only gets faster if it can split its work across them.
Fastest supercomputer Bending
Operations per second of the top machine on the TOP500 list. It grew 80% a year from 1993, but the newest machines sit below the line. In 2024 the line expected 3.53 EFLOP/s, and the fastest machine, El Capitan, reached 1.7. In June 2026 a Chinese machine, LineShine, took first place at 2.2 EFLOP/s, against 10.5 EFLOP/s on the line.
The fastest machines now cost over $500 million and draw around 30 megawatts, so they are built less often. The largest AI clusters, which their owners mostly do not enter on the list, have run far ahead of it.
Price of hard disk storage, per terabyte Bending
Prices fell about 34% a year from 1956. Since about 2010 they have fallen more slowly, and the line now runs far below the real price. In 2023 the line said $1.77 per terabyte; the real price was about $11.
Floods in Thailand in 2011, where many drives were made, stalled the fall for about three years, and since then each gain in how much fits on a disk has come more slowly. Laptops and phones moved to flash memory, shown here as solid-state drives, whose price fell faster until 2023. Since late 2025 demand from AI data centers has pushed memory prices sharply up. Prices are in 2020 dollars.
Best chess program Bending
Rating of the strongest chess program each year. It has gained about 44 points a year since 1985. IBM's Deep Blue beat the world champion Garry Kasparov in a match in 1997, and programs on this list passed the best human rating around 2006. The line says 4,256 Elo by 2035.
Since AlphaZero taught itself chess in a few hours in 2017, the top programs have used neural networks trained on their own games, the same approach behind recent AI. They now draw most games against each other, so ratings at the top are harder to raise, and the newest points fall further below the line each year.
Cost of sequencing a human genome Broken
The cost fell 74% a year after new sequencing machines arrived in 2008. That line pointed to $0.047 by 2020. The real cost stopped falling at around $500.
The fall came from one change, from reading DNA one fragment at a time to reading billions of short pieces at once. Once that change was complete, the costs that were left, for chemicals, machines and labour, fell much more slowly. Newer machines promise a $100 genome, still about 2,000 times what the line said.
Science #
Scientific papers published each year
Articles in indexed science and engineering journals worldwide, as counted by the US National Science Foundation. The number grows 5.2% a year, doubling every 14 years, from 1.07 million in 2000 to 2.55 million in 2018. The line says 8.35 million in 2040.
China passed the US as the largest producer in 2016. The number of papers has grown faster than the number of scientists, and far faster than anyone can read: a researcher who wanted to keep up with one field's output in 2018 had twice as much to read as in 2004. Whether twice the papers means twice the science is a question the line cannot answer.
Papers posted to arXiv each year
arXiv is where physicists, mathematicians and computer scientists post their papers before journals publish them. It took 3,260 papers in 1992, its first full year, and 284,000 in 2025. Since 2000 the number grows 8.9% a year, doubling every 8.1 years, and the line says 928,000 in 2040.
Most of the recent growth is computer science, and within it machine learning. Computer science now posts more papers than all of physics. arXiv has also become where AI results appear first, which is why it is the source for several of the AI lines above.
Age of Nobel laureates in the sciences
The average age at which winners of the physics, chemistry and medicine prizes received them, in five-year periods. It was about 50 until the 1960s and has risen about 0.3 years a year since, to 72.1 years for 2016 to 2020. The line says 71.4 years in 2050.
Winners are older partly because the wait has grown. The gap between the discovery and the prize is now over twenty years on average, and the prize is not given posthumously, so a longer queue means older winners. The discoveries themselves are also made later in life than they were in the age of Einstein and Dirac, as fields grow and take longer to learn.
Chemical elements known Bending
Humanity knew of 35 elements in 1800 and 95 in 1945. From 1800 to 1945 the count rose about one element every three years, and that line pointed to 124 by now. The real number is 118, and it has not changed since 2010.
Every element up to 118 has been found or made, and the seventh row of the periodic table is full. Making the next one means fusing nuclei that fly apart in microseconds. Laboratories in Russia, Japan and Germany have tried for elements 119 and 120 since 2007 and have not yet seen a single atom.
Digits in the largest known prime
The largest known prime had 79 digits in 1951, the first year a computer held the record, and 41 million in 2024. Since then the number of digits grows 20% a year, doubling every 3.8 years, and the line says 13.3 billion in 2050.
Every record since 1996 belongs to GIMPS, a volunteer project that tests Mersenne numbers, those of the form 2ⁿ−1, on home computers and lately on rented graphics cards. The 2024 record took six years to beat the one before it, the longest gap since GIMPS began, because each candidate is harder to test than the last.
Digits of pi computed
ENIAC computed 2,040 digits of pi in 1949. The record stood at 314 trillion in 2025. The number doubles every 23 months (×1.4 a year), and the line says 4.4×10¹⁸ digits in 2050.
The digits themselves are useless: forty would measure the visible universe to the width of an atom. The records are tests of hardware, software and patience, which is why the recent ones were set by a cloud provider, a storage company and a YouTube channel rather than by mathematicians. The current record belongs to StorageReview, a site that tests disk drives.
Coldest temperature ever reached
The lowest temperature produced in a laboratory, in kelvin. It was 90 K in 1877, when oxygen was first liquefied, and 38 pK in 2021, in a cloud of rubidium atoms. The record falls 21% a year, halving every 3 years, and has done so for 150 years.
Each step needed a new trick: liquefying gases, then pumping on them, then magnetic cooling, then lasers and evaporation. The records of 1956, 1993 and 1999 are temperatures of the nuclear spins in a metal, while the metal itself stayed far warmer. Absolute zero cannot be reached, so this line can only ever approach it, and the line says 7.97 fK in 2050.
Energy of the most powerful particle accelerator Bending
The energy of the beam in the most powerful accelerator in the world. From Cockcroft and Walton's 700 keV in 1932 to the Tevatron's 900 GeV in 1986 it doubles every 2.7 years (×1.3 a year), a trend that Stanley Livingston charted in 1954 and that held for another thirty years. On that line the Large Hadron Collider would run at 62.9 PeV; it ran at 6.8 TeV until it shut for an upgrade in June 2026.
Higher energy means a bigger ring, and the ring in Geneva is already 27 km around. The Superconducting Super Collider in Texas, planned for 20 TeV, was cancelled in 1993 with a quarter of its tunnel dug. CERN's proposed successor, a 91 km ring, would not reach full energy before the 2070s.
Progress toward fusion power: the Lawson triple product Bending
A fusion reactor needs a plasma that is hot, dense and well insulated at the same time. The product of the three, in keV·s/m³, is the triple product, and a reactor needs about 3×10²¹. The record went from 2×10¹⁶ on a Soviet tokamak in 1969 to 7.9×10²⁰ on TFTR in 1995, doubles every 22 months (×1.5 a year).
Then the big tokamaks stopped getting bigger, and the record barely moved for twenty years. The recent points are from the laser-driven NIF, which needs a higher triple product than a tokamak does,, which in December 2022 became the first experiment to get more fusion energy out than the laser put in. On the old line the triple product would have passed ignition before 2000. ITER, the tokamak being built in France to get there, is now due to run full power in the late 2030s.
Energy #
Price of solar panels, per watt
Since 1976 the price falls 10% a year, halving every 6.5 years, a 370-fold fall in total. The line says $0.19 per watt in 2030.
Each time the number of panels ever made doubles, the price falls by about a fifth. This pattern, Wright's law, also fits batteries and many other manufactured goods. Panels are now cheap enough that most of the cost of a solar farm is land, wiring, labour and permits, so cheaper panels matter less than they did. The main limit on solar now is storing its power for the night.
Solar's share of world electricity
Solar made 8.7% of the world's electricity in 2025. On a logit scale its share rises in a straight line, which reaches half in 2033 and 83% in 2040.
Solar only works in daylight, so getting half of all electricity from it needs storage on a very large scale, which is why the battery line below matters as much as this one. China installs more than half of the world's new panels.
Sunlight reaching Earth that is turned into electricity
Solar power as a share of all the sunlight that reaches Earth, about 1.5 billion TWh a year. In 2025 it was 0.00018%, and since 2010 it doubles every 2.5 years (×1.3 a year). On the line it passes 1% in 2056 and all of it in 2073.
Using all the energy that reaches a planet is the first level on the astronomer Nikolai Kardashev's 1964 scale of civilisations. Carry the line on and it captures everything the Sun gives off, a Dyson sphere, around 2152. Long before then solar runs into limits of land, materials and demand, which is why the share line above, which cannot pass 100%, is the more believable one.
Price of lithium-ion battery cells, per kWh
Since 1991 the price falls 13% a year, halving every 4.9 years, from $9,210 per kWh to $78 per kWh. The line says $33 per kWh in 2030.
Cheaper batteries made electric cars possible. At around $100 per kWh for a whole car battery pack, an electric car costs no more to build than a petrol one. Cells are now well below that, and in China whole packs are too. The same falls make it cheap to store solar power from the middle of the day for the evening.
Share of new cars that are electric
A quarter of new cars sold worldwide in 2025 were electric, counting plug-in hybrids. On the logit line half are by December 2026, and nine in ten by 2032.
China is far ahead, with about half of its new cars electric, and Europe and the US are behind. Cars stay on the road for 15 years or more, so even on this line most cars being driven burn petrol or diesel until well into the 2030s, and the oil used by cars falls more slowly than sales.
Electricity generated, world
Since 1985 world output grows 2.9% a year, doubling every 24 years, with almost no deviation. The line says 65,800 TWh in 2050.
The International Energy Agency expects demand to grow by 3.6% a year to 2030, faster than the line, as electric cars, heat pumps, air conditioning and data centers all add to it. If that lasts, this is one of the few lines here that will break upward.
Electricity used per person, world
The average person used 2,030 kWh a year in 1985 and 3,860 kWh a year in 2025. The world figure grows 1.6% a year, doubling every 44 years, and the line says 5,608 kWh a year in 2050.
The average hides the spread. China, in blue, went from 387.5 kWh a year to 7,474 kWh a year, more than most of Europe. India, in purple, is at 1,422 kWh a year, and an American uses about 13,000. If the world reached the American level it would need more than three times the electricity it makes now. Sweden, in orange, uses 16,020 kWh a year, more than an American.
Energy used per person, world
All the energy a person uses in a year, counting fuel for cars, heat and industry as well as electricity. The world average was 13,000 kWh a year in 1965 and 21,650 kWh a year in 2024, which is a steady 2,500 watts, day and night. It grows 0.62% a year, doubling every 110 years, and the line says 25,310 kWh a year in 2050.
The American, in blue, uses three and a half times the world average, but peaked at 94,850 kWh a year in 1979 and has drifted down since, as cars, lights and machines waste less. China, in purple, went from 2,124 kWh a year to 34,510 kWh a year, and passed the world average around 2010. Rich countries are using less each and poor ones more, and the world line is what is left when the two are added up. Sweden, in orange, uses 57,510 kWh a year, most of it from hydro, nuclear and wind.
Coal's share of British electricity
Coal made 39% of Britain's electricity in 2012. On a logit scale its share then fell in a straight line, and Britain's last coal plant, Ratcliffe-on-Soar, closed in September 2024.
A carbon price floor added in 2013 made coal more expensive to burn than gas, and wind farms in the North Sea took much of the rest. Britain opened the world's first coal-fired power station in 1882 and became the first G7 country to stop burning coal for electricity.
Electricity from nuclear power, world Broken
Nuclear generation grew 23% a year from 1965 to 1985. That line passed the world's entire electricity use in 1994. Growth slowed sharply in the late 1980s, and output has barely changed since 2006.
The accidents at Three Mile Island in 1979 and Chernobyl in 1986 turned public opinion against new plants, and stricter rules made each one slower and more expensive to build. France's Flamanville 3 took 17 years to finish, and Georgia's Vogtle 3 and 4 cost more than twice their budget. China now approves about ten reactors a year, and Microsoft has signed a deal to restart a reactor at Three Mile Island to power its data centers.
US oil production Broken
Production peaked in 1970, as the geologist M. King Hubbert had predicted in 1956, and then fell for almost forty years. The decline line reached zero in the 2040s. Then fracking arrived, and in 2024 the US produced 60% more oil than in 1970.
Hubbert's method assumes a fixed amount of oil that can be produced. Horizontal drilling combined with hydraulic fracturing, which spread after about 2008, made it profitable to produce oil from shale rock that geologists knew about but could not tap. The US now produces more crude oil than any country ever has.
British coal production Broken
In 1865 the economist William Stanley Jevons warned that Britain's growing appetite for coal would exhaust its mines within a century. This line extends the growth from 1900 to 1913. Output peaked in 1913, and the last deep mine closed in 2015.
Jevons was right that the growth could not go on, but Britain never ran out of coal. Oil, gas and cheaper imported coal replaced it first, and most of the coal is still underground. His other idea, that using a resource more efficiently leads to more of it being used, is now called the Jevons paradox and is often cited about AI.
Planet #
CO₂ in the air
Measured at Mauna Loa in Hawaii since 1958. The amount above the pre-industrial level of 280 ppm grows 2.2% a year, doubling every 32 years. The line says 450 ppm in 2030 and 542 ppm in 2050.
About half of each year's emissions stay in the air, and oceans and forests take up the rest. The level stops rising only when emissions fall to about what those sinks absorb, around half of today's. The newest points sit a little below the line, because emissions have grown more slowly since about 2010.
Methane in the air
Up about 9 parts per billion a year since 2007. The line passes 2,000 ppb in 2032.
Methane traps about 80 times as much heat as CO₂ over twenty years but breaks down within about a decade, so cutting it is the quickest way to slow warming. About 40% comes from wetlands and other natural sources, and the rest from livestock, rice, landfills and leaks from oil, gas and coal. In 2021 more than 100 countries pledged to cut methane emissions 30% by 2030. The line shows no sign of it yet.
All the CO₂ ever emitted
The running total of CO₂ from fossil fuels and cement doubles about every 24 years. On this line the next 24 years add as much CO₂ as all of history before them, for a total of 4.28 trillion tonnes by 2050.
Warming follows this total closely, at roughly half a degree for each trillion tonnes. The newest points sit under the line because yearly emissions have almost stopped growing, so the total now rises in a straight line on an ordinary scale instead of this one. Warming stops when the total stops growing, which is what net zero means.
CO₂ emitted per dollar of world GDP
Since 1950 the CO₂ emitted for each dollar of world output falls 1.4% a year, halving every 49 years. The economy grows faster than that, so total emissions still rise.
To cut emissions while the world economy grows about 3% a year, this line would have to fall more than twice as fast. Britain has managed about 4% a year since 1990, mostly by replacing coal with gas and wind and by moving away from heavy industry.
Global temperature
Compared with 1880 to 1899, from NASA. The trend since 1975 is +0.21°C a decade. It crosses 1.5°C in 2035 and 2°C in 2059. Single years run hotter; 2024 was +1.52°C.
1.5°C is the limit the Paris Agreement aims for, measured as a twenty-year average. Warming seems to have sped up since about 2010. Fitted from 2010 instead, the trend is +0.36°C a decade and the line crosses 1.5°C in 2027. Every extra tenth of a degree makes heatwaves and heavy rain more frequent.
Global sea level
In millimetres above 1880. Satellites have measured a rise of about 3 mm a year since 1993, and the line reaches 337 mm in 2050.
The rate itself is rising and is now over 4 mm a year, so a straight line is the low end of what to expect. Floods ride on top of the sea level, so a few centimetres make a large difference. The IPCC expects floods that used to come once a century to come every year at many coastal places by 2050.
Ice lost by mountain glaciers
The average change in thickness of the world's reference glaciers, in metres of water. They have lost about 30 metres since 1956, and on this line lose about 64 cm more each year.
The loss has sped up, and the newest points are below the line. Melting glaciers raise the sea and, in the long run, shrink rivers that around two billion people depend on in the dry season. Switzerland lost 10% of its glacier ice in 2022 and 2023 alone.
Arctic sea ice in September, area
September is when the ice is smallest. Its area shrinks by about 76,000 km² a year, and the line falls below one million km², the usual definition of an ice-free Arctic, in 2067.
Open water absorbs much more sunlight than ice, which warms the Arctic further, and an ice-free summer would open shipping routes across the pole. The decline has slowed since about 2007, and estimates of the first ice-free September range from the 2030s to after 2050.
Arctic sea ice in September, volume
The ice is getting thinner as well as smaller, so its volume, estimated by the PIOMAS model from observations, falls faster than its area. This line reaches zero in 2034, thirty years before the area line.
The two lines cannot both be right. Thin ice breaks up and melts more easily, so the area could drop quickly once the ice is thin enough, which would make this line the better guide. Since 2021 the points have stayed above it.
Date of peak cherry blossom in Kyoto
Recorded since the year 812, in court diaries and poems collected by the climatologist Yasuyuki Aono. Since 1850 peak bloom has come about eight days earlier per century. In 2026 it was on March 29.
Global warming and the heat of the growing city both push the date earlier. In 2023 the peak came on March 25, the earliest in more than 1,200 years of records. The last few decades run earlier than the line, which suggests the change is speeding up.
Days Lake Mendota is frozen
How long the lake in Madison, Wisconsin, stays frozen each winter, recorded since 1855. It now freezes for about a month less than it did then, losing about two days per decade. This copy of the record ends in 2019.
Single winters swing by more than a month either way, so the line says more than any one year. On it the lake still freezes for about 80.2 days in 2050. Lakes across the northern hemisphere show the same trend, and some that used to freeze every winter now skip years.
Plastic produced each year
Since 1990 world production grows 4.6% a year, doubling every 15 years. The line passes a billion tonnes a year in 2035.
Only about 9% of all plastic waste has ever been recycled. Talks on a global treaty to limit plastic broke down without agreement in late 2024 and again in August 2025, with oil-producing countries opposed to any cap on production.
Living Planet Index
The average change across about 35,000 monitored populations of wild animals, set to 100 in 1970. Since then it falls 2.8% a year, halving every 24 years.
The 2026 report puts the fall since 1970 at 73%, and for freshwater species at 85%. The index is an average of percentage changes, so a few collapsing populations pull it down hard. It does not mean that 73% of all wild animals are gone, though it is often reported that way. The newest points sit above the line.
Large oil spills
Spills of more than 700 tonnes from tankers. There were 29 in 1970 and none in 2020, and on the line the number falls 5.3% a year, halving every 13 years.
Rules requiring tankers to have double hulls, passed after the Exxon Valdez spill in 1989 and in force worldwide by about 2010, explain much of the fall since the 1990s. There were six large spills in 2024, the most since 1997, along with better navigation. Over the same years the amount of oil carried by sea grew.
People #
World population growth rate
It peaked at about 2.2% a year in the 1960s and has fallen in an almost straight line since. The line reaches zero in 2070, which puts peak population at about 10.2 billion.
The line does not stop at zero. Carried on, the growth rate turns negative after 2070 and reaches -0.59% a year in 2100, when there are 9.31 billion people and the number is falling. The UN's 2024 projection is similar, with a peak of about 10.3 billion in the mid-2080s and a slow fall after it. The average woman now has only a little over the two children it takes to replace each generation (see below). The total keeps growing for decades anyway, because the large generations born before 2000 are now having children of their own, and because people live longer.
World population against years left before 13 November 2026 Broken
In 1960 Heinz von Foerster and two colleagues fitted a formula to two thousand years of population figures and found it reaching infinity on Friday 13 November 2026, in four days. On log-log axes the formula is a straight line, and the population followed it until the 1960s. Days before that date the formula says 20.3 trillion people. There are about 8.3 billion.
The formula assumes that more people mean more ideas and more food, so the growth rate rises with the population itself. That held for two thousand years and stopped when families began to have fewer children, first in rich countries and then almost everywhere. The paper was titled "Doomsday: Friday, 13 November, A.D. 2026".
Children per woman, world
Since 1965 the world average falls 1.4% a year, halving every 49 years, from about 5 to 2.18 children per woman. The line passed the replacement rate of 2.1 in 2023.
Below about 2.1, each generation is smaller than the one before. On the line the world average reaches 1.45 children per woman in 2050, about where the European Union was in 2022. Most of the population growth still to come is from sub-Saharan Africa and from countries where most people are still young, where women still have more than four children on average.
Children per woman, South Korea
One of the lowest rates in the world. Since 1960 it falls 3% a year, halving every 23 years, and in 2023 it sat right on the line at 0.8 children per woman. The line says 0.59 in 2030.
At 0.72, every 100 adults have 36 children and 13 grandchildren. High housing costs and fierce competition for education and jobs are the reasons most often given. In 2024 the rate rose for the first time in nine years, to 0.75, and in 2025 it rose again, to 0.80, above the line, which may be the start of a bend.
Children who die before age five, world
It was 43% in 1800 and 3.5% in 2023. Since 1950 it falls 2.6% a year, halving every 27 years.
3.5% is still nearly five million children a year, most of them from causes that are cheap to prevent, such as pneumonia, diarrhoea, malaria and problems around birth. The line says 1.9% in 2050. Large cuts to foreign aid in 2025 have led researchers to warn that child deaths could rise for the first time this century.
Life expectancy, world
Up nearly four months every year since 1950. The line reaches 80 in 2037.
Most of the gain came from fewer children dying. The one large break was COVID, which cut world life expectancy by almost two years between 2019 and 2021. By 2023 it was back above its 2019 level.
Highest life expectancy of any country
Among countries with more than a million people. The record has passed from Sweden to Norway, Australia, Japan and Hong Kong, and has risen three months a year since 1840. The line reaches 90 in 2036.
The demographers Jim Oeppen and James Vaupel drew this line in 2002 and showed that every published estimate of a maximum human life expectancy had been passed within a few years of being made. The newest points sit a little under the line, and some researchers argue that gains are now slowing because the remaining deaths come from ageing itself.
People in extreme poverty
The share of the world living on less than $2.15 a day, the World Bank's line for extreme poverty until 2025. On a logit scale it has fallen in a straight line since 1970, from nearly half to 9.2%. The line says 3% in 2050.
The UN goal is to end extreme poverty by 2030. On this line 7.3% are still poor then, over 600 million people. Most of them live in sub-Saharan Africa, where the share is falling far more slowly, so the world line may flatten as poverty becomes concentrated there.
Food available per person, world
The food supply of the average person, in kilocalories a day, as counted by the UN Food and Agriculture Organization. It has risen by about 12 a year since 1961, from 2,184 kcal a day to 3,006 kcal a day in 2023, while the number of people went from three billion to eight.
In 1968 the best-selling book The Population Bomb said hundreds of millions would starve in the 1970s. Farm yields rose faster than the population instead. The line says 3,271 kcal a day in 2050, a little less than Europeans have now. This is the supply, including what is wasted, and it is an average.
People without enough to eat Broken
The share of the world's people who are undernourished falls 4.6% a year, halving every 15 years between 2000 and 2014, and governments set a goal of ending hunger by 2030. On that line the share in 2025 would be 4.4%. It was 7.8%.
The fall stopped in 2014, mostly because of wars in Africa and the Middle East, and the pandemic and the food price rises of 2022 pushed the share back up, to about 9% in 2021. It has fallen for three years since. The average food supply kept growing through all of it, as the graph above shows. Hunger now is about war and poverty, and the world has not run short of food.
Adults who can read
12% of adults could read in 1820, and 87% in 2023. On a logit scale that is one straight line for two centuries.
Most adults who cannot read are older people who never went to school, so the rate keeps rising as younger generations replace them. Reading at all is a low bar. The World Bank estimates that 70% of ten-year-olds in poor and middle-income countries cannot read and understand a simple text.
Young people in university, world
The number of students in higher education, as a share of everyone in the five years after school-leaving age. It was 10% in 1970 and 42% in 2022, and the line says 77% in 2050.
The line bent upward around 1995, when China and then India began building universities at a rate no country had before. A degree was once a mark of the few. In most rich countries it is now what the majority has, which changes what it is worth.
People with electricity
92% of the world's people had electricity at home in 2024, up from 73% in 1998. The logit line reaches 98% by 2050.
About 650 million people still have none, most of them in sub-Saharan Africa. The UN goal is everyone by 2030; on the line it is 94%. Cheap solar panels and batteries now let homes and villages get power without waiting for the grid.
People using the internet Bending
Three in five people in 2020, when this series ends. The logit line passes 90% in 2030.
The UN's telecoms agency puts it at 74% in 2025, well below the line's 76%, so the line is bending. The people still offline are mostly poorer, older and rural, and many of them live where there is a signal but cannot afford a phone or a data plan.
People living in cities and towns
The share of the world's people who live in urban areas, which each country defines for itself. It was 34% in 1960 and 57% in 2024, passing half in 2007. On a logit scale the rise is one straight line, which reaches 67% in 2050.
The UN expects about two-thirds by 2050, which is what the line says. Almost all the growth is in Asia and Africa, where cities are adding about 65 million people a year. The rich world is about 80% urban and now rising only slowly, so the line levels off as the rest catches up.
Parliament seats held by women
Up about 0.6 percentage points a year since 1995, along one of the straightest lines of all. At that pace women hold half the world's seats in 2060.
Most of the gains came from quotas for candidates or seats, now used in more than 130 countries. Rwanda's lower house has been more than half women since 2008. On the line, parity arrives 167 years after women first voted in a national election, in New Zealand in 1893.
People living in democracies Broken
The share of the world's people living in electoral or liberal democracies, as classified by the V-Dem project. It rose from about a third in the 1970s to just over half in 2016, and that line pointed to 64% by 2025. Instead it fell to 27%.
Most of the drop is one country. In V-Dem's data India, with 1.4 billion people, has been an electoral autocracy since 2017, because of curbs on the press, civil society and the opposition. Hungary, Turkey and others moved the same way, and by V-Dem's measure the level of democracy enjoyed by the average person is back to where it was in 1978. India also explains the earlier dip in 1975 to 1977, when Indira Gandhi suspended elections and civil liberties during the Emergency.
Guinea worm cases
Reported human cases fell from 892,000 in 1989 to 10 in 2022. On the line the number falls 30% a year, halving every 24 months, and reaches a single case in 2029.
There is no vaccine or cure. The campaign led by the Carter Center since 1986 has worked by teaching people to filter their drinking water, and Guinea worm would be the second human disease ever eradicated, after smallpox. But human cases stayed between 13 and 15 a year from 2021 to 2024 and fell to 10 in 2025, the fewest ever, and the worm also infects dogs in Chad, so the end of this line is the hardest part.
Polio cases Broken
The campaign to eradicate polio began in 1988. From then to 2016 reported cases of paralysis falls 16% a year, halving every 3.9 years, from tens of thousands to 42. The line said about 80 for 2021. There were 649.
The wild virus is still cornered in Afghanistan and Pakistan. Most cases now come from the oral vaccine itself, whose weakened virus can spread and regain its strength where too few children are vaccinated. A new, more stable vaccine has been in use since 2021. Guinea worm, above, shows the same last mile.
Fatal airliner accidents per million flights
Since 1970 the rate falls 5.5% a year, halving every 12 years.
The rate is now so low that a single crash moves it from one year to the next. Most of the gain came from better engines and warning systems, and from investigating every accident and sharing what went wrong.
Life #
Americans aged 25 to 34 who are married
From the General Social Survey, which has asked a sample of Americans the same questions since 1972. The married share of 25-to-34-year-olds fell from 77% in 1972 to 38% in 2024, about three-quarters of a percentage point a year. The line passed half in 2002 and reaches 16% in 2050. Part of this is delay, because people marry later (see the next graph), and many still marry in their late thirties. But a growing share never marries, and more couples live together without marrying. The 2021 survey, taken online during the pandemic, sits well below the line.
Age at first marriage, women
The median age at which American women first marry fell to 20.1 in 1956, the youngest on record. Since about 1970 it has risen in a straight line, by about seven weeks every year, to 28.6 years in 2021. The line says 31.9 years in 2050.
Women in Sweden, in blue, marry at 34.8 years and in South Korea, in purple, at 30.8 years, on lines that rise faster. Men marry about two years later. Longer education and women's careers are the usual explanations. Later marriage also means later children. The average age of a first-time mother rose from 21.4 in 1970 to 27.5 in 2023, according to the CDC.
Divorces per 1,000 people
The American divorce rate peaked around 1980. Since then it falls 1.9% a year, halving every 36 years, and it was 2.5 per 1,000 people in 2021. The line says 1.54 per 1,000 people in 2050.
Fewer marriages mean fewer divorces, and Americans who marry later divorce less. Other countries are converging on the same level from below: Sweden, in blue, has been near 2 since the 1970s, and South Korea, in purple, rose from 0.4 in 1970 to 1.8.
Babies born to unmarried mothers Bending
The share of births to women who were not married. It rose in a straight line from 5.3% in 1960 to 41% in 2009, by about three-quarters of a percentage point a year. Then it stopped. It was 41% in 2020, and the line, carried on, would say 57% by 2030.
The bend came with the fall in teenage births, below, and in births among women in their early twenties, who are the least likely to be married. Most of these babies are not born to single parents in the old sense. About six in ten unmarried mothers live with the father.
Births to teenagers, world
Births per 1,000 women aged 15 to 19. The world rate was 91.7 per 1,000 in 1960 and 41.9 per 1,000 in 2022. Since 1990 it falls 1.9% a year, halving every 36 years, and the line says 23.9 per 1,000 in 2050.
Girls who stay in school longer marry later and have their first child later, and that is most of the story everywhere. The United States, in blue, fell much faster, from 61.3 per 1,000 in 1991 to 15.1 per 1,000, as teenagers had less sex and used better contraception. Rates in sub-Saharan Africa are still close to 100. Sweden, in purple, is at 3.31 per 1,000.
Young Americans who spend an evening with friends each week Broken
The share of 18-to-29-year-olds who spend a social evening with friends at least once a week. From 1974 to 2016 it stayed near 42%, on an almost flat line. Then it fell, to 28% in 2024.
The fall began before the pandemic, though the 2021 survey, taken during it, was the lowest. Smartphones and social media, which most teenagers had by about 2015, are the most common explanation, along with more time spent at home; how much each matters is still argued over. The American Time Use Survey shows the same fall, with young Americans spending far less time with friends in person than they did in the early 2000s.
Americans who never go to religious services
The share of adults who say they never attend religious services rose from 9.7% in 1972 to 30% in 2024, about a third of a percentage point a year. The line says 39% in 2050.
For most of the last century churches were where Americans met people outside work and family, and Gallup found that church membership fell below half of Americans for the first time in 2020. The last four surveys all sit around 30%, so the rise may be levelling off.
Hours Americans spend online each week
Hours a week spent on the internet, not counting email, among people who use the web, as reported to the General Social Survey. It was 5.13 hours a week in 2000 and 16.5 hours a week in 2022, rising about half an hour a week every year. The line says 24.6 hours a week in 2040.
That is already more than two hours a day, and people underestimate screen time when asked. Phone-based measurements put it far higher, with Americans now looking at their phones for over four hours a day. The survey asked about the internet; it did not ask what people did there, so there is no line here for short videos, which did not exist as a category when the question was written.
Americans who read a newspaper every day
The share of adults who read a newspaper daily fell from 69% in 1972 to 16% in 2024. On a logit scale the fall is one straight line for fifty years, and it reaches 9.2% in 2040.
The fall began long before the internet, with television news, and the line did not bend when the web arrived. Daily readers are mostly over 50, so the share keeps falling as they die. The survey counts print and online editions alike.
Americans who read for pleasure on a given day
The share of people aged 15 and over who read for personal interest on an average day, from the government's time-use survey. It fell from 26% in 2003 to 16% in 2025, by about half a percentage point a year. The line reaches 1.6% in 2050.
The people who do read spend about as long as they did, around an hour and a half. It is the number who read at all that is falling. The share who play games, in blue, rose from 7.8% to 15% over the same years and is about to pass it. Scrolling through short videos counts as neither, so the activity taking most of the new screen time has no line of its own.
Length of a hit song
The average length of the songs on the Billboard Hot 100. It rose from 147.8 seconds in 1959 to 281 in 1992, as albums and FM radio let songs run. Since then it has lost about 2.4 seconds a year, and it was 191.9 seconds in 2021. The line says 155 seconds in 2040.
Streaming pays per play once a listener passes thirty seconds, so a short song that gets replayed earns more than a long one, and an intro is a risk. On this line the hit song returns to the length of a 1959 single in 2042. This data ends in 2021.
Cinema tickets sold in the US and Canada Broken
Ticket sales peaked at 1.58 billion in 2002 and slid by about 16 million a year until 2019. That line says 1.16 billion for 2023. The real number was 921 million.
The pandemic shut cinemas in 2020 and a fifth of the audience never came back. Home screens got larger, films reached streaming within weeks, and the price of a ticket doubled over the same twenty years. Takings look healthier than tickets, because each ticket costs more.
Babies given one of the ten most popular names Bending
The share of American babies whose name was among that year's ten most popular for their sex. It was 29% in 1950 and 7.6% in 2024. Since 1990 it falls 2.4% a year, halving every 28 years, though the fall has slowed since about 2005.
In 1950 almost one boy in ten was named James or Robert. In 2024 the most popular boy's name, Liam, went to about one boy in eighty. Parents look harder for names that stand out, and immigration has widened the pool.
Cigarettes sold per American adult
Sales rose for sixty years and peaked at about 11 a day per adult in 1963. Since 1981 the number falls 3.5% a year, halving every 19 years, to 3 a day in 2014, where this series ends. On the line it falls below one a day in 2046.
The 1964 Surgeon General's report, which tied smoking to lung cancer, was the turning point. Warning labels, advertising bans, higher taxes and bans on smoking indoors followed. The share of adults who smoke fell from 42% in 1965 to about 11% in recent years. Vaping, which this graph does not count, has taken some of its place, especially among the young.
Adults who smoke or use tobacco, world
The share of adults worldwide who use tobacco, from the WHO. It fell from 34% in 2000 to 23% in 2020, by about half a percentage point a year, and the line says 11% in 2040.
That is still more than a billion people, about four in five of them men. Taxes, smoking bans and warning labels drove most of the fall, and in many countries fewer young people start.
Alcohol drunk per American Broken
Litres of pure alcohol per person a year, from beer, wine and spirits. After Prohibition ended in 1933 drinking climbed back, and from 1960 to 1981 it rose 1.5% a year. That line pointed to 17.5 litres a year by 2013. The real figure was 8.86 litres a year, about the level of the late 1960s.
Drinking fell in the 1980s and early 1990s as campaigns against drunk driving took hold, a 1984 federal law pushed the drinking age back up to 21, and warning labels arrived in 1989. It crept up again after the late 1990s, in spirits and wine, while beer fell. Surveys suggest a larger change now. In 2025 Gallup found that 54% of Americans drink at all, the lowest share since it began asking in 1939.
Drug overdose deaths in the US Broken
From 1999 to 2021 overdose deaths rose 7.6% a year, in three waves: prescription painkillers, then heroin, then fentanyl. That line pointed to 120,000 deaths in 2025. Instead deaths peaked at about 108,000 in 2022 and fell to 70,600 in 2025, and the latest provisional count, for the twelve months to May 2026, is about 66,000. Naloxone, which reverses an overdose, went on sale without a prescription in 2023, more people are in treatment, and the drug supply itself has changed. Researchers still disagree about how much each mattered.
Adults with obesity, world
The share of adults worldwide with a body mass index of 30 or more, as estimated by the World Health Organization. It was 5% in 1980 and is 16% now. On a logit scale it is one of the straightest lines there is, and it says 31% in 2050.
The United States, in blue, is measured by weighing a national sample. It rose from 14.5% around 1978 to 42.5% in 2017 and 2018, and the newest survey found 40.3%, the largest fall in the series. Gallup found the share of adults taking GLP-1 drugs such as Wegovy for weight loss reached 12.4% in 2025. The world line has not bent, and the drugs still cost more than most of the world can pay.
Suicides per 100,000 people, world
The world rate, adjusted for age, falls 2.1% a year, halving every 33 years, from 13.6 per 100,000 in 2000 to 8.85 per 100,000 in 2021. The line says 5.83 per 100,000 in 2040.
Most of the fall is in China and India, where rural women in particular now die this way far less often, and in Russia. The United States, in blue, has gone the other way, from 9.99 per 100,000 to 14.1 per 100,000. Sweden, in purple, has barely moved, at about 11.7 per 100,000.
Sex #
How often American adults have sex
The number of times adults said they had sex in the past year, averaged over everyone, from the General Social Survey. It was 58 times a year in 1989 and 40.3 times a year in 2024. The line loses about one time every two years and reaches 31.6 times a year in 2050.
The fall is about the same at every age. In 2024 about a quarter of 18-to-29-year-olds said they had not had sex at all in the past year, against about one in seven around 1990. Fewer young adults live with a partner, and more of their time is spent at home and online; researchers disagree about which matters most. The 2012 survey is left out, because almost all of its "not at all" answers are missing from the data.
Americans who identify as lesbian, gay, bisexual or transgender
Gallup has asked since 2012. The share went from 3.5% to 9% in 2025, and the line says 27% in 2040. The General Social Survey, in blue, asks only about sexual orientation and shows the same rise from a smaller sample.
Almost all of the rise comes from the young, and most of it from people who say they are bisexual. About a quarter of adults under 30 now give one of these answers, against 3% of those over 60. The line cannot hold for long as drawn, since it has the country as a whole passing today's young adults within fifteen years.
Americans who have had a same-sex partner
The share of adults who say they have had sex with someone of their own sex since turning 18. It was under 4% in the early 1990s and 16% in 2022. The line says 29% in 2040.
The rise is larger among women than men. It has run a little ahead of the rise in people who call themselves gay or bisexual, so more people now report the experience than the identity.
Americans who see nothing wrong with sex before marriage
The share who say sex before marriage is "not wrong at all". It was 26% in 1972 and 65% in 2024, and the line says 78% in 2050.
The line was flat from 1980 to 2005 and has risen quickly since, as the generations raised before the 1960s died. Over the same years Americans have had less sex, not more, as the first graph in this section shows.
American men who have paid for sex
The share of men who say they have ever paid for sex or been paid for it. It fell from 17% in 1991 to 8.7% in 2022, and the line says 4.6% in 2050.
The older men in the early surveys came of age when visiting a prostitute was a common first experience, especially in the armed forces. Each generation since has done it less.
Americans who think men should earn and women should keep house
The share who agree that it is better for everyone if the man is the achiever outside the home and the woman takes care of the home and family. It was 65% in 1977 and 25% in 2022.
The 2024 survey found 32%, the first clear rise in the series and well above the line. Other surveys find the same turn among young men. One point is not a trend, but it is the point to watch.
Countries where same-sex couples can marry
The Netherlands was the first, in 2001. There are 38 now, and the count has risen by about 1.6 countries a year along a nearly straight line. It says 76 countries in 2050.
So far the list is mostly Western Europe, the Americas, Australia and New Zealand, with South Africa, Taiwan and Thailand. About 65 countries still treat sex between men as a crime, so the line has a long way to run before it meets real resistance, and it will meet it.
Deaths from AIDS, world
Deaths peaked at 2.1 million in 2004. Since then the number falls 6.1% a year, halving every 11 years, to 628,000 people in 2024. The line says 110,000 people in 2050.
The fall is the work of antiretroviral drugs, which about 30 million people now take, most of them paid for by governments and by American and international aid. The newest points sit above the line, and the aid cuts of 2025 put the line at risk.
Violence #
Murders per 100,000 people, world
The world rate falls 1.2% a year, halving every 59 years, from 6.93 per 100,000 in 2000 to 5.2 per 100,000 in 2023. The line says 3.87 per 100,000 in 2050.
Europe, in purple, has fallen from 7.76 per 100,000 to 2.1 per 100,000, mostly because of Russia. The Americas, in blue, have barely moved, and now have about a third of the world's murders with an eighth of its people. Sweden, in orange, has stayed near 1.15 per 100,000 for thirty years.
Murders per 100,000 people, Western Europe since 1300
The historian Manuel Eisner collected murder rates from court and coroner records in England, Italy, Germany and Switzerland, the Low Countries and Scandinavia. The average was about 41 per 100,000 in 1300 and is under 1 now. Over seven centuries it falls 0.6% a year, halving every 120 years.
A medieval Italian town was about as dangerous as the most violent cities in the world today. The fall came first in England and the Netherlands and last in Italy, in blue. The usual explanations are states that took over the punishing of wrongs, and a slow change in how men were expected to answer an insult.
Deaths in war per 100,000 people Broken
Soldiers and civilians killed in fighting that involves at least one state. From 1946 to 2011 the rate falls 4.9% a year, halving every 14 years, with peaks for Korea, Vietnam and the Iran-Iraq war that were each lower than the last. On that line the rate in 2023 would be 0.236 per 100,000. It was 1.51 per 100,000.
The line broke with the war in Syria in 2012. The wars in Ethiopia in 2021 and Ukraine from 2022 made those two years the deadliest since the 1980s. The blue series adds massacres and fighting between militias, and includes the genocide in Rwanda in 1994.
Share of world output spent on the military Bending
In 1960 the world spent 6% of its output on armed forces. From then to 2018 the share falls 1.9% a year, halving every 36 years, to 2.1%. The line says 1.7% for 2024. The real figure was 2.5%, and rising.
Spending rose in every region in 2024, the fastest yearly rise since the Cold War. NATO members agreed in 2025 to aim for 3.5% of GDP on core defence by 2035, and 5% with related spending, which would take the rich world back to the levels of the 1980s.
Nuclear warheads in the world Bending
The stockpile peaked at about 70,000 in 1986. Since then it falls 4.3% a year, halving every 16 years, but the newest counts sit above the line, at 12,240 warheads in 2025.
Most of the fall came from the US and Russia taking apart warheads under arms-control treaties. The last of those, New START, expired in February 2026, and China has added about 100 warheads a year since 2023. The number ready for use is rising again, even as old warheads are still being taken apart.
Americans who approve of spanking children
The survey asks whether it is sometimes necessary to discipline a child with a spanking. In 1986, 83% of American adults agreed. In 2024, 54% did, below the line, which says 42% in 2050.
Sweden banned hitting children in 1979, and about 70 countries have followed. No American state has, and corporal punishment is still legal in the public schools of about a third of them.
Americans in prison or jail Broken
People held in state and federal prisons and local jails, per 100,000 of the population. The rate stayed near 200 from the 1940s to the 1970s. From 1978 it rose about 21 a year, and that line pointed to 1,135 per 100,000 by 2022. Instead it peaked at 765 per 100,000 in 2007 and fell to 554 per 100,000 in 2022.
The rise came from the war on drugs, mandatory minimum sentences and three-strikes laws. The fall came as crime dropped, states cut sentences to save money, and the pandemic emptied jails. The US still locks up more of its people than any other large country, about four times the rate of Britain and eight times that of Germany.
Views #
Americans who think most people can be trusted
The General Social Survey has asked since 1972 whether most people can be trusted or whether you cannot be too careful. The share saying people can be trusted fell from 47% in 1972 to 25% in 2024, by about a third of a percentage point a year. The line says 19% in 2050.
Each generation trusts less than the one before and does not catch up as it ages, so the fall continues as older Americans die. Trust is lowest among the young and the poor. Nordic countries answer the same question at 60% or more, and the US is now close to the average for the rest of the world.
Americans who see nothing wrong with gay relationships
The share of adults who say sexual relations between two adults of the same sex are "not wrong at all". It was 13% in 1990, about where it had been since the question was first asked in 1973, and 56% in 2024. On a logit scale the rise since 1990 is a straight line that reaches 83% in 2040.
This is one of the fastest changes of opinion ever measured, and it moved a decade ahead of the law: same-sex marriage became legal nationwide in 2015, when the line was passing 50%. Opinion moved mostly by people changing their minds, and partly by generation, with each cohort more accepting than the last. The 2024 reading fell from 63% in 2022, the first drop in twenty years.
Americans who think marijuana should be legal
Support for legalising marijuana was 18% in 1990, lower than in the 1970s, and 67% in 2024. On a logit scale the rise since 1990 is a straight line, which reaches 88% in 2040.
The law followed the line with a lag of about a decade. Colorado and Washington legalised recreational use in 2012, when support was about 47%, and by 2025 twenty-four states had. Federal law still bans recreational use. Support for the death penalty, asked in the same survey, has moved the other way since 1994.
Money #
GDP per person
Average income per person, adjusted for inflation and for price differences between countries, in 2021 dollars. The world figure grows 2.2% a year, doubling every 32 years since 1950, to $21,200 in 2024, and the line says $37,900 in 2050.
The United States, in blue, has grown at a little under 2% a year since 1870, through the Depression and two world wars, and electricity, cars and computers each failed to bend it. If AI is as large as the AI lines at the start suggest, this is the kind of line it would have to bend. Germany, in purple, fell to a third of its trend in 1946 and was back on it by 1966.
China, in orange, went from $1,040 in 1980 to $23,800, and passed the world average around 2020. India, in teal, is at $9,820, about where China was in 2009. In sub-Saharan Africa, where the population is growing fastest, income per person has barely grown since 2014.
Output per hour worked
What an hour of work produces, adjusted for inflation and for prices between countries. In the United States it grows 1.8% a year, doubling every 39 years since 1950, so an American worker now produces in one hour what took four hours then. Since 2005 growth has averaged about 1.2% a year, and the newest points sit below the line.
Germany, in blue, grew 5.9% a year from 1950 to 1975 while it rebuilt, reached the American level, and then slowed to the American pace. Catching up is faster than leading, because a country behind can copy what already exists. China, in purple, has grown about 7.5% a year since 1978 and is at $17.7 an hour, a fifth of the American $83.5. It will slow the same way when it gets close. Sweden, in orange, is at $80.7 an hour, close behind.
Hours worked per worker
Germans worked 3,284 hours a year in 1870 and 1,335 in 2023. Since 1950 the German number falls 0.84% a year, halving every 82 years, and the line reaches 1,000 hours, about 20 a week, in 2050.
American hours fell for a century and then stopped around 1980. Americans worked 1,789 hours in 2023, about as much as in 1980 and a third more than Germans. Chinese workers put in about 2,330, roughly what Germans worked in the early 1950s.
In 1930 John Maynard Keynes predicted that his grandchildren would work 15 hours a week. On the German line that arrives in 2079, about 150 years after his essay. Since about 2000 the fall has slowed, and the newest points sit above the line.
Workers who farm, world
In 1991, 43% of the world's workers worked on the land. In 2023 it was 27%, and the line says 14% in 2050.
In rich countries the share is under 3%, and they grow more food than ever. Leaving the farm is how every country that is rich today became rich. Most of the world's remaining farmers are in South Asia and Africa.
Women in the labour force, world
The share of women aged 15 and over who work for pay or are looking for work. The world figure has slipped by about a point a decade, from 51% in 1991 to 48% in 2022, and the line says 44% in 2050.
Most people expect this line to rise, and in rich countries it did. The United States, in blue, went from 33% in 1948 to 60% in 1999 and has drifted down since. The world figure falls because girls stay longer in school, populations age, and in India and China fewer women work for pay than a generation ago. Sweden, in purple, has been steady at about 63% for thirty years.
Workers' share of US business output
The part of what American businesses produce that is paid to workers as wages and benefits, as an index set to 100 in 2017. It stayed between about 107 and 117 for half a century. Since 2000 it has fallen about half a point a year, to 95 in early 2026, and the line says 83.3 in 2050.
The rest goes to the owners of capital, as profits, interest and rent. Economists point to some mix of automation, trade, a few very large companies and weaker unions. If AI takes over more of the work, this is the line that would fall faster.
Wealth owned by the richest 1%, Britain Broken
In 1910 the richest 1% of people in Britain owned 68% of everything that could be owned. From then until 1985 their share fell by about 0.7 percentage points a year, through two wars, death duties, inflation and the spread of home ownership. On that line they would have owned nothing by 2015.
The fall stopped in the mid-1980s at about 18%, and the share is 21% now. The United States, in blue, fell less and has climbed back to 35%. India, in purple, has gone from 13% to 40% since 1961 and is now the most unequal of these. China, in orange, went from 16% in 1978 to 30%. Sweden, in teal, followed Britain down and has since risen to 27%.
Income taken by the richest 1% of Americans
The share of all income, before tax, that goes to the best-paid hundredth of adults. It was 10% in 1976 and has risen by about 0.2 percentage points a year since, to 21%, back where it was in the 1920s. The line says 27% in 2050.
India, in blue, has risen faster, from 6% in 1982 to 23%. For the world as a whole, in purple, the share has been close to 20% since 2000, because the gap between countries has narrowed while the gaps inside them have widened. China, in orange, doubled from 7% to 14% between 1979 and 2015. Sweden, in teal, is at 9.7%, about where it was in the 1950s.
Pay of American chief executives, as a multiple of a worker's Bending
What the heads of the 350 largest American firms are paid, divided by the pay of a typical worker in the same industries. It was 20.6 times in 1965. Until 2000 the multiple doubled about every nine years, and that line says 1,215 times for 2025. It was 324.7 times.
Most of the rise was pay in shares and options, so the multiple moves with the stock market: it peaked at 380 in 2000, at the top of the dot-com boom, and has moved between 170 and 410 since. The figures before 1989 are filled in between a few survey years.
Pages of US federal regulations
The total length of the Code of Federal Regulations, where every federal rule is written down. It grew from 9,750 pages in 1950 to 194,000 in 2024. Since 1975 it has added about 2,300 pages a year, and the line says 256,000 in 2050.
The line has held under presidents of both parties, including those who promised to cut regulation. Pages are a rough measure, since one page can matter far more than another, but since 1975 the code has never shrunk by more than about 5%, and never for more than two years running.
World trade as a share of world output Bending
Exports plus imports, as a share of world GDP. From 1970 to 2008 it rose from 26% to 60%. The line says 67% for 2024. The real figure was 57%, lower than in 2008.
The rise came from container shipping, the opening of China and the former Soviet bloc, and factories that split their work across borders. All three were one-off changes and were complete by 2008. Tariffs have risen since 2018, and trade in services, which this understates, is still growing.
S&P 500 stock index
Without dividends and without adjusting for inflation. Since 1950 it grows 7.4% a year, doubling every 9.8 years, and it now sits 56% above the line.
With dividends added, the total return has been about 11% a year. The index was last this far above the line around 2000, when it peaked 94% above. It got back to its 2000 high in 2007, fell again, and passed it for good in 2013. The line says 25,740 in 2050.
US consumer prices
Since 1983 the price level grows 2.6% a year, doubling every 27 years, so a dollar loses half its value every 27 years. The years since 2023 sit above the line.
The Federal Reserve has aimed for 2% a year since 2012, on a measure that usually runs a little below this one. Prices rarely come back down after a burst of inflation, so the level stays above the old line even after inflation returns to normal. On the line a 2025 dollar buys 54 cents of goods in 2050.
Sport #
Men's marathon world record
Since 1998 the record has fallen by about 13 seconds a year, along a line straight enough to plan by. Fitted to the records up to 2023, the line reached two hours in 2027. Sabastian Sawe ran 1:59:30 in London in April 2026.
The line says 1:54:47 in 2050. Shoes with carbon plates and thick foam, introduced in 2017, are worth a minute or two, and the records since then sit on the same line as the ones before, which suggests the shoes replaced gains that would otherwise have slowed.
People who reach the top of Everest each year Bending
Two people stood on the summit in 1953. From then until 2007 the yearly number grows 11% a year, doubling every 6.8 years, and that line says 1,445 summits for 2024. There were 870 summits, about the same as in 2019. Counts differ by a few dozen depending on who is counted, but every count shows the same plateau.
The mountain is full. Nearly everyone climbs in the same few days of calm weather in May, on two routes, and queues at the top now kill people. Nepal has raised its permit fee and China caps the numbers on its side. No one reached the summit in 2015, the year of the earthquake.
Hot dogs eaten by the winner of Nathan's Fourth of July contest Bending
For twenty years the winner ate between 10 and 25. In 2001 Takeru Kobayashi ate 50, and from then until 2021 the winning total rose by about 1.4 a year, to Joey Chestnut's record of 76. The line says 83 hot dogs for 2026. Chestnut won with 66 hot dogs. Kobayashi's jump was a change of method: he broke each hot dog in half and dunked the bun in water. The slow rise after it was training. The contest was cut from twelve minutes to ten in 2008, and Chestnut is now 42.
Space #
Objects launched into space each year
Mostly satellites. Fewer than 200 a year went up from the late 1960s to 2012. Since then the number doubles every 2.5 years (×1.3 a year), and the line says 17,900 in 2030.
Most of the growth is SpaceX's Starlink, which has launched about 13,000 satellites, and SpaceX, Amazon and two Chinese networks plan tens of thousands more. More objects in orbit raise the risk of collisions that make more debris, which could make some orbits unusable.
Planets known outside the solar system Bending
The count doubled every three years from 1995, then slowed after the Kepler telescope's large haul in 2016. The 2023 count sits 54% below the line.
Kepler found more than 2,600 planets by staring at one patch of sky for four years. Its successor, TESS, looks at brighter, nearer stars and finds fewer planets that are easier to study. The count passed 6,000 in 2025. NASA's Roman telescope, launched in August 2026, and ESA's PLATO, due in 2027, are expected to find thousands more, which could put the count back on the line.
2030, 2040, 2050 #
What the world looks like if every line that is still holding keeps going. Bending and broken lines are left out. Where two lines contradict each other, at least one of them has to bend.
2030
An AI agent does 11 work-years of software work in one go. Nvidia sells $503 billion of chips a quarter, and OpenAI and Anthropic take in 7.4% of world GDP. Every AI benchmark above is solved.
78% of new cars are electric, solar makes 28% of the world's electricity, and a battery cell costs $33 per kWh. The world is 1.38°C warmer all the same.
There are 8.61 billion people. Guinea worm is gone. 19% of adults are obese and 17% use tobacco. Same-sex couples can marry in 44 countries. The marathon record is 1:59:16, a hit song lasts 179.4 seconds, and Americans spend 19.8 hours a week online while 12% of them read for pleasure on a given day.
2040
The AI lines stop making sense. An agent's task length is 6.98 billion work-years, more than all the work done by everyone on Earth in a year, a mark it passed in 2039. Nvidia's yearly revenue passed the whole world economy in 2038, and OpenAI and Anthropic's did in 2031. Either these lines bend or the economy's own line does.
Solar has made more than half of the world's electricity since 2033. Arctic ice volume reached zero in 2034, though the extent line still shows 3.07 million km² of ice each September. The world is 1.59°C warmer.
There are 9.25 billion people. The average woman has 1.67 children, and in South Korea 0.44. 67% of young people are at university and 18% of workers farm. 27% of Americans identify as LGBT, 88% want marijuana legal, and 9.2% still read a newspaper every day. The US federal rulebook runs to 234,000 pages, the coldest place in the universe is a laboratory at 81.1 fK, and the average science Nobel goes to someone aged 69.7.
2050
A chip has 838 trillion transistors, more than the connections in a human brain, a count it passed in 2043. Pi is known to 4.4×10¹⁸ digits, which are no more use than the first forty were.
Solar makes 98% of the world's electricity. CO₂ is at 542 ppm, the world is 1.8°C warmer, and the sea is 337 mm higher than in 1880.
There are 9.74 billion people, twenty years short of the peak of 10.2 billion in 2070. 1.9% of children die before the age of five, 3% of people live in extreme poverty, women hold 44% of the seats in parliaments, and the average person has 3,271 kcal a day of food.
The average person on Earth earns $37,900 a year, about what a German did in 1990. Germans work 1,000 hours a year. The S&P 500 is at 25,740, and a 2025 dollar buys 54 cents of goods.
39% of Americans never go to a religious service, 16% of those aged 25 to 34 are married, and adults have sex 31.6 times a year. 1.6% read for pleasure. The world murder rate is 3.87 per 100,000, a hit song lasts 130.6 seconds, and somebody has run a marathon in 1:54:47.
Some of this will happen. The lines do not say which part.