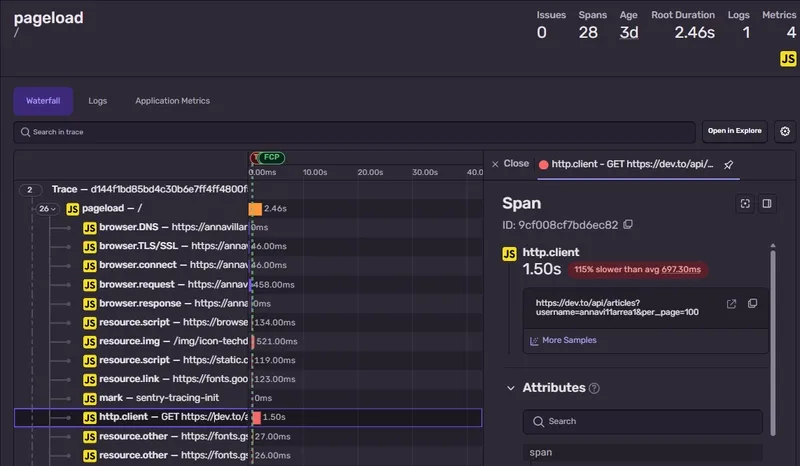
browser.request
(TTFB) alone was 2,068ms. That is nearly half of the total load time spent just waiting for the server to wake up and start talking.## The bottleneck breakdown
When I dug into the spans for that slow load, the sequential nature of the bottleneck became obvious:
DNS lookup: 107msConnection: 553msTLS/SSL handshake: 281msTTFB (Time to First Byte): 2,068msResponse download: 1,052ms Comparing this to my average load time of 194ms shows that these spikes aren't just "internet noise"—they're actual performance regressions. I used Sentry's AI assistant, Seer, to parse the logs, and it pointed out that calls to the dev.to API were the primary culprit. The p95 latency for those requests was hitting 1.37 seconds, meaning a significant chunk of my users were getting a sluggish experience. Google Fonts were also adding unnecessary weight to the critical path.
Fixing the critical path #
To tackle this, I looked at two main strategies for my AI workflow and backend optimization. First, the obvious fix: stop making the browser fetch external API data on every single request. Moving that fetch to the backend and caching it is a no-brainer since articles don't update every second.
Second, for the remaining client-side calls, I shifted to a lazy- pattern. By moving these requests out of the critical path and using skeletons, the page becomes interactive immediately. The API call still takes the same amount of time, but the user isn't staring at a blank screen while it happens.
Implementing a smarter cache #
The real win came from tuning Nginx. To handle those p95 spikes, I implemented a combination of proxy_cache_background_update
and proxy_cache_use_stale
.
Here is the logic: I set a 15-minute TTL. When that expires, the first visitor still gets the cached copy instantly while Nginx refreshes the cache in the background. If the external API goes down or rate-limits me, the site continues to serve the last known good copy for up to a day.
The results were immediate. Looking at my p50 trends:
August 4: 3.3s p50August 5: 1.3s p50
That is roughly a 60% improvement in median load time overnight. It's a great reminder that "good enough" performance often hides massive spikes that only a deep dive into tracing can uncover.
Next Connecting LLM agents to Slack or Teams usually feels like a →
these real-world AI monetization case studies, with plenty of directly applicable cases.