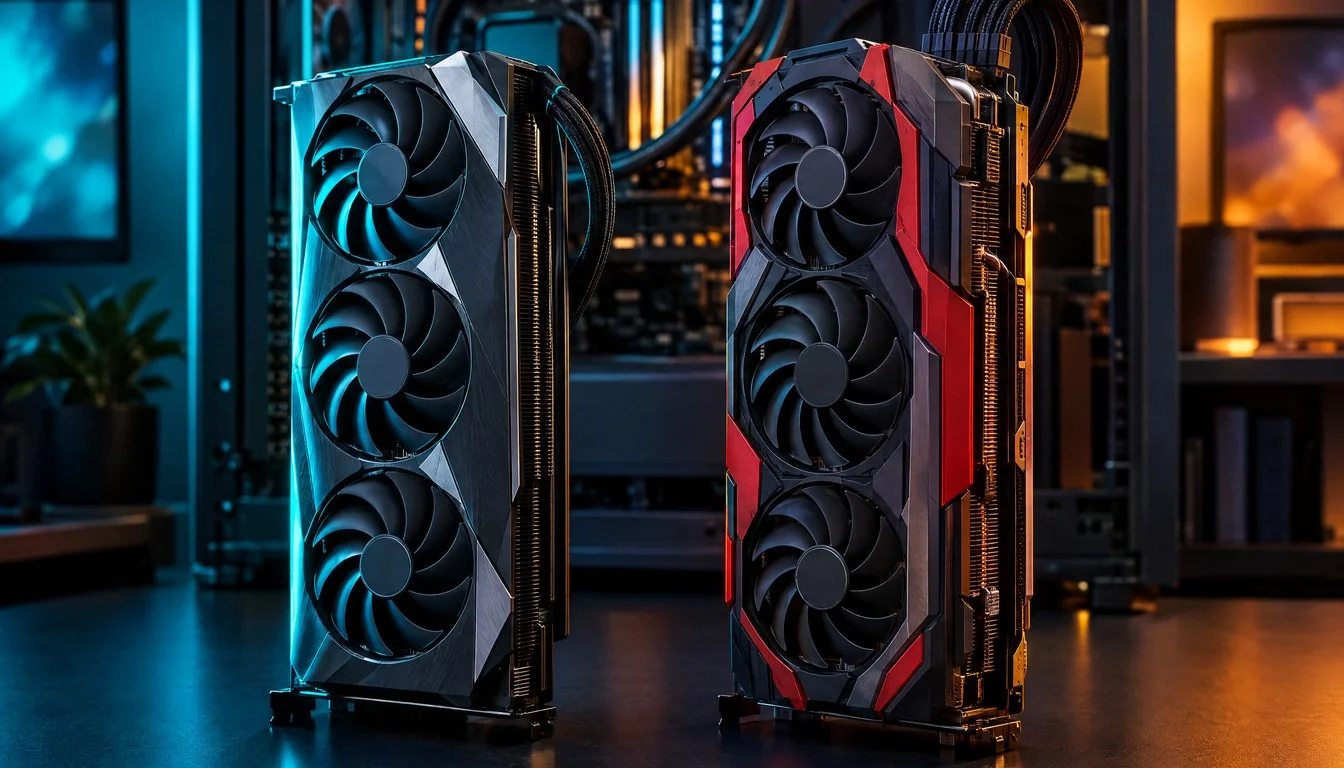
Wccftech is reporting that NVIDIA’s GeForce RTX 5080 climbed from 1.4 FPS to 310 FPS in a DirectX Raytracing test once Clustered Geometry was switched on. The outlet’s headline, “NVIDIA RTX 5080 Sees Over 220X FPS Boost With New DirectX Raytracing Technology, Outpaces RX 9070 XT By 3.4X,” also reached Telecompaper. The arithmetic behind the claim holds up: 310 divided by 1.4 is about 221.
The catch sits in the word test. The numbers come from one Microsoft sample, D3D12RaytracingClusteredGeometry, which stresses a single expensive step in ray tracing. NVIDIA lists the GeForce RTX 5080 at $999.00 with 16 GB of GDDR7, 10,752 CUDA cores and a 2.62 GHz boost clock, but none of those specs explain a 221x swing. The sample does.
So this piece separates what the test shows from what the headline implies. If you want the broader picture across real games first, our RTX 5090 vs 5080 vs RX 9070 XT benchmark comparison is the better starting point, because a rebuild-bound sample says little about a typical frame.
Don't miss new tech stories on Google
Add Shattered once in the Google app and our stories show up in your news suggestions.
RTX 5080 vs RX 9070 XT: The Headline Numbers #
Wccftech’s figures fall into three groups. The first is raw frame rate. With traditional bottom-level acceleration structure (BLAS) rebuilding, the RTX 5080 managed 1.4 FPS. With Clustered Geometry enabled, it hit 310 FPS. That is roughly 221 times the frame rate.
The second group is time and memory. Rebuilding the acceleration structure dropped from 720 ms to 1.0 ms, a 720x improvement. Memory held by the acceleration structure fell from 4,716 MB to 267 MB, which is 94.3% lower. Ray-dispatch time barely moved, going from 1.8 ms to 2.0 ms.
The third group is the RTX 5080 vs RX 9070 XT comparison. The Radeon RX 9070 XT recorded 91 FPS with Clustered Geometry on, against 310 FPS for the RTX 5080. Wccftech calls that about 3.4 times faster in this specific test. With the feature off, the order flips. The RX 9070 XT scored 1.7 FPS and the RTX 5080 scored 1.4 FPS.
That last detail matters more than the 3.4x gap. It tells you the two cards are close when both do things the old way, and far apart only once the new path runs. The rest of this article works through why that happens and how far it travels beyond one sample.
What the D3D12RaytracingClusteredGeometry Sample Measures #
Microsoft’s sample exists to compare two ways of preparing a scene for ray tracing. One rebuilds the acceleration structure the traditional way. The other uses Clustered Geometry. The test then reports frame rate, rebuild time, ray-dispatch time and acceleration-structure memory for each. Wccftech ran it on the RTX 5080 and the RX 9070 XT and published the results.
The traditional path: rebuilding BLAS
A BLAS is the structure a GPU builds so rays can find triangles quickly instead of testing every one. When geometry changes, that structure may need rebuilding. In the old path, the rebuild is the whole story in this sample: 720 ms on the RTX 5080. At that cost, nothing else in the frame matters.
The Clustered Geometry path
With Clustered Geometry on, the same RTX 5080 rebuilt in 1.0 ms. Wccftech’s headline calls this “new DirectX Raytracing technology,” but that phrase is the outlet’s wording and not a formal product or technology name in the facts we can confirm. What we can confirm is the sample’s name and the measured outcome.
One more point on method. The sample isolates a bottleneck by design. A test built to expose rebuild cost will show enormous gains when the rebuild cost vanishes. That is a feature of the benchmark, and it shapes how far the headline number can travel.
The Full RTX 5080 Result Table #
The table below lays out every reported RTX 5080 figure from the test. Rows marked derived are our own arithmetic on Wccftech’s numbers, so treat them as checks and not as reported results.
| Metric (GeForce RTX 5080) | Traditional BLAS rebuild | Clustered Geometry on | Change |
|---|---|---|---|
| Frame rate | 1.4 FPS | 310 FPS | About 221x higher |
| Acceleration-structure rebuild time | 720 ms | 1.0 ms | About 720x faster |
| Ray-dispatch time | 1.8 ms | 2.0 ms | 0.2 ms longer (about 11%) |
| Acceleration-structure memory | 4,716 MB | 267 MB | 94.3% lower |
| Rebuild plus dispatch (derived) | 721.8 ms | 3.0 ms | About 240x lower |
| Frame time implied by FPS (derived) | About 714 ms | About 3.2 ms | About 221x lower |
Notice that ray dispatch got slightly worse with the feature on. The 0.2 ms increase is small, but it shows the new path is not free on every axis. It simply trades a tiny dispatch cost for a huge rebuild saving.
Why the Frame Rate Jumps 221x: The Rebuild Was the Bottleneck #
The 221x figure looks suspicious until you convert frame rate into frame time. At 1.4 FPS, each frame takes about 714 ms. The rebuild alone takes 720 ms. Add 1.8 ms of ray dispatch and you get 721.8 ms, which works out to roughly 1.4 FPS once you allow for rounding.
frame_time_ms = 1000 / FPS

RTX 5080, traditional rebuild:
  1000 / 1.4            = about 714 ms per frame
  720 + 1.8             = 721.8 ms (rebuild + dispatch) -> about 1.39 FPS

RTX 5080, Clustered Geometry:
  1000 / 310            = about 3.2 ms per frame
  1.0 + 2.0             = 3.0 ms (rebuild + dispatch)   -> about 333 FPS

RX 9070 XT, Clustered Geometry:
  1000 / 91             = about 11.0 ms per frame
Those pieces line up. The frame in the old path is almost entirely rebuild time. In the new path, rebuild shrinks to 1.0 ms and the frame is nearly all dispatch. The reported 310 FPS sits slightly under the 333 FPS that rebuild plus dispatch alone would give, which suggests a few tenths of a millisecond of other work per frame.
This is why the number is large without being fraudulent. A frame that spends 99.7% of its time rebuilding one structure will speed up enormously when that step nearly disappears. The same trick cannot repeat in a frame that spends most of its time shading pixels, because shading does not shrink when a rebuild gets cheaper.
RTX 5080 vs RX 9070 XT: Why the Gap Is 3.4x #
The RTX 5080 vs RX 9070 XT table puts both cards side by side in both modes. Again, rows marked derived come from our own division of the reported figures.
| Setting | GeForce RTX 5080 | Radeon RX 9070 XT | Who leads |
|---|---|---|---|
| Clustered Geometry off (FPS) | 1.4 FPS | 1.7 FPS | RX 9070 XT, about 1.21x |
| Clustered Geometry on (FPS) | 310 FPS | 91 FPS | RTX 5080, about 3.4x |
| Gain from enabling the feature (derived) | About 221x | About 53.5x | RTX 5080 gains more |
| Frame time, feature off (derived) | About 714 ms | About 588 ms | RX 9070 XT |
| Frame time, feature on (derived) | About 3.2 ms | About 11.0 ms | RTX 5080, about 7.8 ms shorter |
Read the table twice before repeating the headline. The RX 9070 XT does not look weak here. Its own jump from 1.7 FPS to 91 FPS is about 53.5x, which would be a startling result in any other context. The RTX 5080 simply jumps further.
What the 1.7 FPS footnote tells us
With Clustered Geometry off, AMD’s card led by roughly 21%. That ordering matters because it argues against a general NVIDIA speed advantage in ray tracing as the explanation. If the RTX 5080 were simply faster at everything, it would lead in both modes. It does not.
The result points instead to how each card, and its driver, handles the Clustered Geometry path specifically. The reported facts do not say whether the difference comes from hardware, drivers or sample tuning, and we will not guess. For now it is one data point on one sample, and it favors NVIDIA by a wide margin.
Memory: 4,716 MB Down to 267 MB #
The memory result may matter more than the frame rate. Acceleration-structure memory fell from 4,716 MB to 267 MB, a 94.3% reduction. Divide the old figure by the new one and you get about 17.7x less memory for the same scene.
Put that against the card. The RTX 5080 carries 16 GB of GDDR7. If you count 16 GB as 16,384 MB, the traditional acceleration structure alone ate roughly 29% of the card’s memory. The Clustered Geometry version used under 2%. A scene that once left little room for textures and buffers suddenly leaves plenty.
Memory capacity is a live topic around this card. We have tracked how RTX 5080 24GB kits are still pending at board partners, which shows buyers care about headroom on the 16 GB model. A technique that frees gigabytes of space inside the existing 16 GB changes that conversation, at least for ray-traced workloads that adopt it.
Keep the limits in view. The memory number applies to the acceleration structure in this one sample. It does not mean a game will use 94.3% less VRAM overall, because textures, geometry buffers and render targets still take their share.
What Is Confirmed, Reported and Unconfirmed #
Stories like this travel faster than their caveats. The table sorts the claims by how well they are supported, using NVIDIA’s own listings for specifications and price and Wccftech’s report for the test.
| Claim | Status | Basis |
|---|---|---|
| Product is the GeForce RTX 5080 from NVIDIA | Confirmed | NVIDIA product listing |
| 16 GB GDDR7, 10,752 CUDA cores, 2.62 GHz boost clock | Confirmed | NVIDIA specifications |
| List price of $999.00 | Confirmed | NVIDIA listing |
| Top DirectX 12 feature tier on the spec page | Confirmed | NVIDIA lists Yes |
| 1.4 FPS to 310 FPS in D3D12RaytracingClusteredGeometry | Reported | Wccftech test |
| RX 9070 XT at 91 FPS, RTX 5080 about 3.4x faster | Reported | Wccftech test |
| “New DirectX Raytracing technology” as a formal name | Unconfirmed | Headline wording only |
| A 220x boost outside this synthetic test | Unconfirmed | No supporting data |
| A named speaker’s on-record quote about the result | None found | No source identified |
Two items deserve emphasis. First, no one has put a named person on record about these results in the sources we reviewed, so this article carries no expert quotes. Second, the wider 220x claim has no support beyond the sample. Anyone repeating it as a general RTX 5080 speedup is stretching the evidence.
Why 220x Will Not Show Up in Your Games #
Here is the plain version. A game frame contains many jobs: geometry processing, shading, lighting, post-processing, ray tracing and more. The sample strips most of those away and leaves acceleration-structure work as the dominant cost. Fix that one cost and the frame rate explodes.
In a shipping game, rebuild cost is usually one slice of a frame and not the entire thing. Cut that slice to nearly zero and you gain whatever time the slice occupied. If it took 10% of the frame, you win back 10%. That is a useful gain, but it sits nowhere near 221x. We cannot put a number on any specific title because the facts available to us include none.
Adoption also takes time. A game must be built or patched to use Clustered Geometry, and the engine must feed it the right data. Until studios do that work, a card’s result in this sample is a capability signal and not a performance guarantee.
Software support is the other half. Drivers decide how well a card runs any new path, and driver quality moves quickly. Our AMD vs NVIDIA driver and feature support chart tracks that gap for RTX 50 and RX 9000 cards. Wccftech separately reported that NVIDIA’s latest Game Ready driver reportedly delivers up to an 8.1% path tracing boost, although games see little benefit. Gains reported at that scale are a useful yardstick for what a driver can deliver in games.
Pricing and Market Impact for a $999 Card #
NVIDIA lists the RTX 5080 at $999.00. A headline claiming a 220x boost on a card at that price invites a buying decision, so the numbers need context. Nothing in the test changes what the card does in games you can play today. It changes what developers might build tomorrow.
Buyers also face a gap between list and street. We have followed how RTX 5090 and wider RTX 50 street prices have strayed from NVIDIA’s listings, and a separate report covered GPU prices climbing 11% in Japan. A synthetic result like this one will not move those prices. Supply and demand do that.
For AMD, the stakes are reputational more than financial in the short term. A 3.4x headline gap, even in a narrow test, shapes forum threads and review talking points. The 1.7 versus 1.4 FPS footnote gives AMD supporters a rebuttal, though a weak one, since nobody plays at 1.7 FPS.
For NVIDIA, the story is useful marketing built on a result the company did not have to produce itself. For developers, it is a prompt to evaluate whether their scenes spend enough time rebuilding to justify a code change.
Historical Context: Rebuild Costs Have Always Haunted Ray Tracing #
Real-time ray tracing arrived on consumer hardware with a built-in tension. Fast ray queries depend on a good acceleration structure, and a good structure costs time to build. Static scenes pay that cost once. Moving characters, destructible walls and streaming worlds pay it again and again.
Developers spent years working around that. Common tactics include building structures for static geometry offline, refitting instead of rebuilding for animated objects, and limiting how much of a scene can change. Those workarounds shape level design and engine architecture, and they leave less room for scenes with huge amounts of detail that also move.
Microsoft’s sample points at a different approach: treat geometry in clusters so changes touch a small part of the structure. We make no claim here about when the idea first appeared or how many vendors support it, since those details are outside the verified facts. The historical lesson is simpler. Each time a platform vendor removes a rebuild bottleneck, scenes get denser.
NVIDIA lists the RTX 5080 as supporting Microsoft’s top DirectX 12 feature tier, the tier where these ray tracing capabilities live. That puts the RTX 5080 in the group of cards that can run such features at all. It does not tell us how well any particular card runs them, which is exactly what the 3.4x gap addresses.
Where This Touches AI and Neural Rendering Workloads #
This story sits at the edge of our AI and machine learning coverage, and the link is worth spelling out. The following is our analysis and not a reported finding.
AI-generated and AI-assisted content tends to produce geometry that changes often. Neural techniques that reconstruct, animate or synthesize shapes at runtime hand the ray tracing pipeline scenes that do not stay still. Any technique that makes frequent geometry updates cheap lowers the penalty for that style of content.
The memory angle carries over too. AI workloads and rendering workloads compete for the same 16 GB on an RTX 5080. Freeing several gigabytes from the acceleration structure leaves more room for model weights, upscalers or texture data when a game runs AI features alongside ray tracing.
We would stress the word could. The sample says nothing about neural rendering, and no source we reviewed links the two. The connection is a reasonable inference from how the pieces fit, and readers should weigh it that way.
Five Predictions for What Happens Next #
These are our expectations, framed as judgment calls and not as facts. None rests on a leaked roadmap or a source we can name.
- Reviewers will copy the test. Expect other outlets to run D3D12RaytracingClusteredGeometry on their own RTX 5080 and RX 9070 XT units. Results will vary with drivers and system configuration, and the 3.4x gap may narrow or widen.
- Real-game gains will be a small fraction of 221x. Any title that adopts the technique will see improvement in proportion to how much of its frame went to rebuilding. Single-digit and low double-digit percentage gains are far more plausible than triple-digit multiples.
- AMD will answer through drivers or developer guidance. An RTX 5080 vs RX 9070 XT gap this visible tends to prompt a response. The 91 FPS result suggests the RX 9070 XT runs the path well, just not as well as the RTX 5080.
- Frame time will replace FPS in the coverage. A figure like 1.4 FPS invites ridicule, while 714 ms versus 3.2 ms explains the mechanism. Careful outlets will show both.
- Street prices will ignore the test. Availability and demand drive GPU pricing, and a single synthetic sample will not alter either.
If you track upcoming hardware, our look at the RTX 50 plans for CES 2027 covers what leakers have and have not confirmed. Treat any such leak with the same care you would give this headline.
How to Read and Verify Results Like These #
The facts available to us leave out test-system details such as CPU, driver version, resolution and number of runs. Before you cite the 310 FPS figure, check for those. A credible reproduction should report them.
- Record both modes on the same machine, with the same driver, in the same session.
- Log frame time in milliseconds alongside FPS so the mechanism is visible.
- Capture rebuild time, ray-dispatch time and acceleration-structure memory, the same four metrics Wccftech reported.
- Repeat each run several times and report the spread, not a single best score.
- State plainly that the sample is synthetic and that the result is a ceiling for rebuild-bound scenes.
- Test a real game if one supports the feature, and publish that number next to the sample number.
Laptop buyers should note that the figures here describe a desktop RTX 5080 only. Laptop parts with similar names are different chips, which we compared in our RTX 5090, 5080 and 5070 Ti gaming laptop comparison. Do not assume a laptop will reproduce a desktop result.
The Takeaway on the RTX 5080’s 310 FPS Result #
The takeaway: the number is real and narrow, and the RTX 5080 vs RX 9070 XT gap is real only inside this sample. The RTX 5080 did go from 1.4 FPS to 310 FPS in Microsoft’s Clustered Geometry sample, the RX 9070 XT reached 91 FPS, and acceleration-structure memory dropped 94.3%. Those figures come from Wccftech’s test and they are internally consistent.
What the figures do not show is a 220x speedup for the card in general. They show a sample where one huge cost vanished. Developers should treat it as a strong sign that cluster-based ray tracing deserves testing, and buyers should treat it as a curiosity until games catch up.
Frequently Asked Questions #
Does the RTX 5080 really get a 220x FPS boost?
Only in one test. Wccftech reported 1.4 FPS with traditional BLAS rebuilding and 310 FPS with Clustered Geometry in Microsoft’s D3D12RaytracingClusteredGeometry sample, about 221x. No data supports that multiple in games or other workloads.
How much faster is the RTX 5080 than the RX 9070 XT in this test?
In the RTX 5080 vs RX 9070 XT matchup, the RTX 5080 scored 310 FPS against 91 FPS with Clustered Geometry on, about 3.4x faster. With it off, the RX 9070 XT scored 1.7 FPS against 1.4 FPS for the RTX 5080.
How much memory does Clustered Geometry save?
Acceleration-structure memory dropped from 4,716 MB to 267 MB on the RTX 5080, a 94.3% reduction. That figure covers the acceleration structure only, not total VRAM use.
Is “new DirectX Raytracing technology” an official product name?
We could not confirm it. The phrase appears in Wccftech’s headline, and the confirmed details are the sample name and the measured results. Treat the phrase as descriptive wording.
What are the RTX 5080’s specifications and price?
NVIDIA lists 16 GB of GDDR7, 10,752 CUDA cores, a 2.62 GHz boost clock, support for Microsoft’s top DirectX 12 feature tier and a price of $999.00.
Will my games run hundreds of times faster?
No. The sample is built so that rebuilding the acceleration structure dominates the frame. Real games spend time on shading and other work, so any gain from Clustered Geometry would be a small fraction of the sample result, and only in titles that support it.
Why did the RX 9070 XT beat the RTX 5080 with the feature off?
The reported numbers show 1.7 FPS for the RX 9070 XT and 1.4 FPS for the RTX 5080 in the traditional path, but they do not explain why. Hardware, drivers and sample behavior could all play a role.