, and kindly contributed to
T. Moudiki's Webpage - R R-bloggers]. (You can report issue about the content on this page
here)
Want to share your content on R-bloggers?
click hereif you have a blog, or
hereif you don't.
What if you could put Python or R code in an HTML page, double-click the file, and have it run? No server, no build step, no install, and nothing sent anywhere: everything runs in the browser.
That’s what pyr.js does. I built it this week with Claude (Anthropic’s AI assistant), which wrote the code and tests from my design decisions and verified everything in a headless browser. The heavy lifting is done by Pyodide (Python compiled to WebAssembly) and webR (same thing for R). pyr.js is the glue: a single file, about 460 lines you can actually read, that finds the Python and R code in your page and connects it to your HTML.
A first example #
Save this as an .html file and open it in your browser:
<script src="https://cdn.jsdelivr.net/gh/Techtonique/[email protected]/pyr.js"></script>

<p id="count">count = 0</p>
<button py-click="add_one()" py-out="count">Add</button>

<script type="text/python">
count = 0

def add_one():
    global count
    count += 1
    return f"count = {count}"
</script>
py-click runs Python when the button is clicked, and py-out says where the result goes. Any DOM event works the same way (py-input, py-change, …), and for R, it’s r-click, r-input, and so on. R’s printed output and plots show up directly in the page:
<label>Points: <input type="range" min="10" max="500" value="100"
       r-input="hist(rnorm(as.numeric(.value)))" r-out="plot"></label>
<div id="plot"></div>
Here, .value (_value in Python) holds the slider’s current value, and the histogram is redrawn as you move it.
Python and R compute, JavaScript draws #
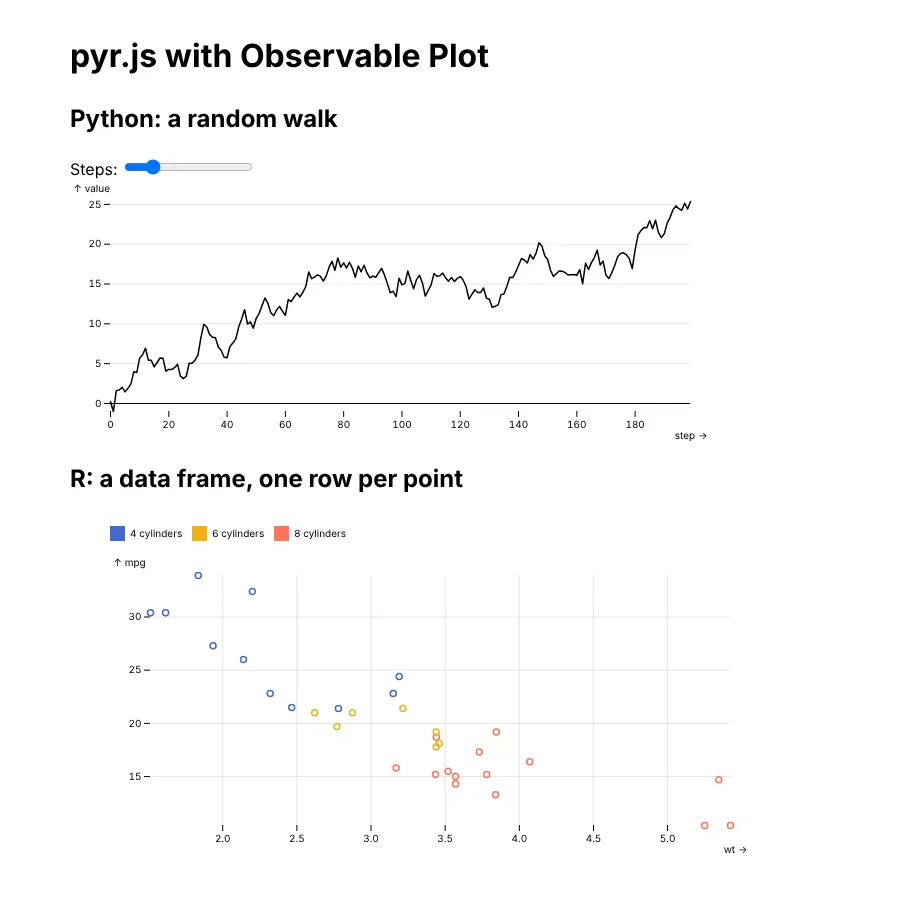
My favorite part: results can be passed as data to any JavaScript chart library. In a previous post, I used Observable Plot and Highcharts for dashboards. With pyr.js, py-then / r-then hand the result to a function of your choice. An R data frame arrives as an array of rows, ready to plot:
<script src="https://cdn.jsdelivr.net/npm/[email protected]/dist/d3.min.js"></script>
<script src="https://cdn.jsdelivr.net/npm/@observablehq/[email protected]/dist/plot.umd.min.js"></script>
<script src="https://cdn.jsdelivr.net/gh/Techtonique/[email protected]/pyr.js"></script>
<script>
  function draw(rows, el) {
    el.replaceChildren(Plot.dot(rows, { x: "wt", y: "mpg", stroke: "cyl" }).plot());
  }
</script>

<script type="text/r">
cars <- function() {
  d <- mtcars
  d$cyl <- factor(paste(d$cyl, "cylinders"))   # factors arrive as text
  d[, c("wt", "mpg", "cyl")]
}
</script>

<div r-ready="cars()" r-then="draw" r-out="chart"></div>
<div id="chart"></div>
The same works with Python: lists of dicts, numpy arrays and pandas DataFrames are converted for you. Here’s the Observable Plot example from the repository, with a Python random walk (redrawn by a slider) and the R data frame above:
How fast is it? #
The first visit downloads the engines (several MB for Python, cached by the browser afterwards), and starting Python takes about 3 seconds. Nothing magical so far.
The interesting part: when pyr.js is hosted on the same site as your pages, Python runs in a shared worker. Other tabs of the site, and even page reloads, reuse the interpreter that’s already running: in my tests (Chromium), the page was ready in under 0.1 second instead of 3. Each tab still has its own variables, and a reload still starts the page fresh. For R, webR doesn’t allow this (yet), so it starts with each page.
There’s also a live editing mode for development: put your Python code in a .py file, add data-watch to the script tag, and your changes apply to the running page as soon as you save, without re.
Privacy #
pyr.js sends nothing anywhere. No analytics, no telemetry: your code and your data stay in the visitor’s browser. The only network requests are for the engines themselves and the packages your code imports.
Try it #
The repository is on GitHub (MIT license), with four examples: the basics, Observable Plot, Highcharts and live editing. The README explains the rest (attributes, data conversion, self-hosting the engines, pinning a version with an integrity hash). Feedback, issues and stars are welcome!
leave a comment for the author, please follow the link and comment on their blog:
.
T. Moudiki's Webpage - R R-bloggers.comoffers
about
daily e-mail updates Rnews and tutorials about
learning Rand many other topics.
Click here if you're looking to post or find an R/data-science job.
Want to share your content on R-bloggers?
click hereif you have a blog, or
hereif you don't.