Ninety Sky uses a new approach, a classification LLM called Jev, to predict the next ninety minutes of rain for an 8-kilometre cell around you. Jev reads live radar and NOAA's models and answers with a probability; a blend fitted on real outcomes turns that into the forecast, and every forecast is graded against what fell. Here's how it works, and how it scores.
0.99 AUC in the next 15 minutes: rain and dry told apart almost perfectly.
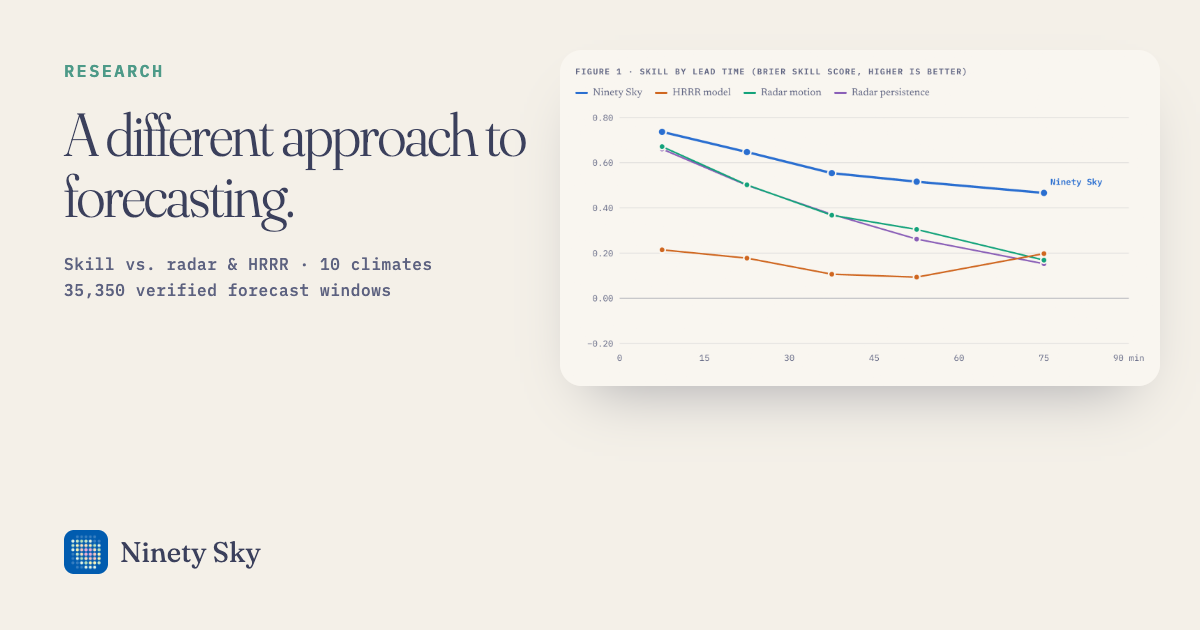
2.4× the skill of the HRRR model alone, 60–90 minutes out, where models should be strongest.
+0.22 skill added by Jev at 45–60 minutes, over the same blend without it.
12 of 12 hours where our chance of rain beats the National Weather Service's.
Rain apps sound surer than they are. #
Most weather apps answer "will it rain?" with an icon and a number for a whole city, taken from one source. Radar extrapolation, the approach Dark Sky made famous, is sharp for the next fifteen minutes and then falls apart as storms grow and decay. Weather models see those changes coming but blur where they happen. Neither tells you how sure it is.
Ninety Sky treats the forecast as a probability, and shows it. The ribbon's height is the chance of rain, minute by minute. Its colour is how hard. Every number is then checked against what really fell on the block, and the recipe only changes when it gets better.
Four inputs, one judge, one blend, graded every few minutes. #
Every five minutes, for each place someone is looking at, the engine answers one question per window: will it rain on this block between now and 15 minutes, 15 and 30, 30 and 45, 45 and 60, and 60 and 90?
Radar comes from NOAA's Multi-Radar Multi-Sensor mosaic, read every two minutes and pooled to an 8 km cell around the block. Motion estimates how the rain field is moving and slides it forward. The neighbourhood measures how much rain sits within reach of the block along that motion, and how active the wider 50 km area is, so a storm parked nearby counts even when nothing is aimed straight at you. The models are HRRR, NOAA's 3 km hourly-updating model, and the National Weather Service's hourly chance of precipitation.
Jev is a classification LLM: rather than writing text, it reads a compact description of all of it and answers each window with a probability. It doesn't write the forecast; it judges it. A logistic blend then combines Jev's answer with the raw inputs, one set of weights per window, fitted on past days and judged on days it never saw. A final calibration step maps the blend's number to how often it has actually rained.
Better than any single source, at every lead time. #
We scored each forecast window as a yes-or-no event: did the radar show rain of at least 0.2 mm/h at the block at any scan in the window? Skill is measured against climatology, the dumb forecast that always predicts the average chance of rain; 0 is no better than that and 1 is perfect.
| Lead time | Cases | Rain rate | Ninety Sky | HRRR | Radar motion | Radar persistence | Ninety Sky AUC |
|---|---|---|---|---|---|---|---|
It holds up from Seattle drizzle to Southeast storms. #
The shadow fleet forecasts 24 cities around the clock, chosen to cover ten climates. Here is every window, scored per climate, wherever it rained enough to score.
| Climate | Cities | Cases | Rain rate | Ninety Sky | HRRR | Radar motion |
|---|---|---|---|---|---|---|
| Pacific Northwest | Seattle, Portland | 2,553 | 11% | 0.79 | 0.32 | 0.69 |
| Southwest monsoon | Phoenix, Tucson, Albuquerque | 4,130 | 10% | 0.60 | 0.01 | 0.51 |
| Plains | Dallas, Oklahoma City, Kansas City | 4,081 | 3% | 0.56 | 0.11 | 0.44 |
| Southeast storms | Charlotte, Atlanta, Orlando | 6,436 | 17% | 0.50 | 0.16 | 0.27 |
| Northeast | New York, Boston, Washington | 4,940 | 5% | 0.45 | 0.09 | 0.19 |
| Appalachians & Front Range | Denver, Asheville | 2,649 | 8% | 0.36 | -0.65 | 0.07 |
What the judge adds. #
To isolate Jev's contribution, we recomputed every forecast with Jev's answer replaced by the fixed rule the engine falls back on when it can't reach the model. Everything else, the inputs and the fitted weights, stays the same.
Is 30% really 30%? #
A forecast can rank rain and dry perfectly and still be wrong about the odds. Reliability diagrams compare what we said with what happened: every point on the dotted diagonal is a perfectly honest number. Dot size is the number of cases.
| Held-out day | Cases | Error before | Error after | Change |
|---|---|---|---|---|
| Sep 20 | 1,404 | 0.0790 | 0.0777 | -1.7% |
| Sep 21 | 1,018 | 0.0772 | 0.0763 | -1.1% |
| Sep 22 | 1,183 | 0.0751 | 0.0735 | -2.0% |
| Sep 23 | 7,342 | 0.0271 | 0.0267 | -1.6% |
| Sep 24 | 11,527 | 0.0194 | 0.0192 | -0.9% |
| Sep 25 | 6,059 | 0.0150 | 0.0148 | -1.3% |
How a change ships. Calibration curves were fitted on all but one day and scored on the day they never saw, six times over. They lowered the 0–60 minute error on every held-out day, so they're live. At 60–90 minutes the result swung from better to 11% worse depending on the day, so that window stays uncalibrated until there's more weather in the log.
The hours, against the National Weather Service. #
Past the ribbon, Ninety Sky shows twelve hours. Its hourly chance blends Jev with HRRR, leaning on radar early and on the models late. Here it's scored against the Weather Service's own hourly chance of precipitation for the same place and hour.
Definitions and caveats. #
- Event
- Rain of at least 0.2 mm/h at the block's 8 km cell on any MRMS scan inside the window. Windows with too few scans to decide are dropped, never counted as dry.
- Brier score
- Mean squared difference between the forecast probability and the outcome (1 for rain, 0 for dry). Lower is better.
- Skill
- 1 − Brier ÷ Brier of climatology, where climatology always forecasts that window's observed rain rate. 0 means no better than the average; below 0 is worse.
- AUC
- The chance a randomly chosen rainy case got a higher forecast than a randomly chosen dry one. 0.5 is a coin flip; 1 is perfect ranking.
- Baselines
- Persistence forecasts rain if it's raining now. Radar motion is our straight-line extrapolation. HRRR is its point chance of rain for the hour. These are our implementations, logged beside the blend, not other companies' apps.
- Data
- Every forecast issued by the production service from September 20 to September 25, 2026: 7,709 forecasts across 38 places, 35,350 verified windows, 2,864 of them rainy.
What this doesn't show yet. It's 6 days of late-September weather: no snow or ice yet, and the West and Mountain cities saw no rain at all, so they count in the totals but can't be scored on their own. A fixed fleet of 24 cities across ten climates forecasts around the clock, and this page is regenerated from that log as it grows. We'll publish the misses along with the wins.