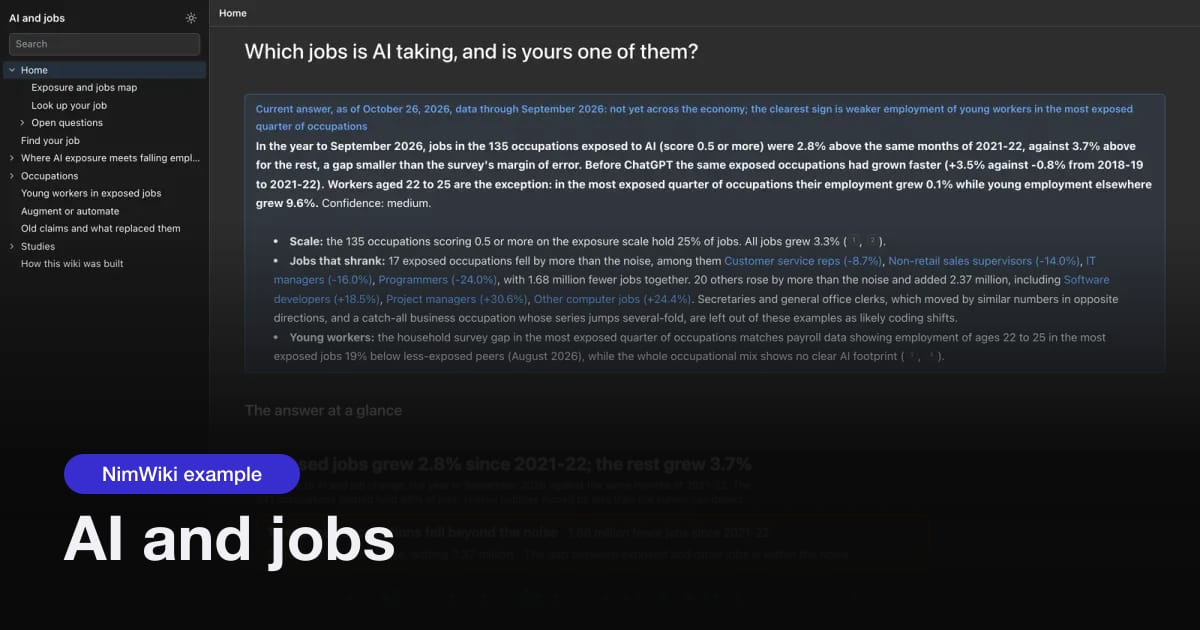
Note: Current answer, as of October 26, 2026, data through September 2026: not yet across the economy; the clearest sign is weaker employment of young workers in the most exposed quarter of occupations In the year to September 2026, jobs in the 135 occupations exposed to AI (score 0.5 or more) were 2.8% above the same months of 2021-22, against 3.7% above for the rest, a gap smaller than the survey's margin of error. Before ChatGPT the same exposed occupations had grown faster (+3.5% against -0.8% from 2018-19 to 2021-22). Workers aged 22 to 25 are the exception: in the most exposed quarter of occupations their employment grew 0.1% while young employment elsewhere grew 9.6%. Confidence: medium.
Scale: the 135 occupations scoring 0.5 or more on the exposure scale hold 25% of jobs. All jobs grew 3.3% (Census CPS, Eloundou et al.). Jobs that shrank: 17 exposed occupations fell by more than the noise, among them Customer service reps (-8.7%), Non-retail sales supervisors (-14.0%), IT managers (-16.0%), Programmers (-24.0%), with 1.68 million fewer jobs together. 20 others rose by more than the noise and added 2.37 million, including Software developers (+18.5%), Project managers (+30.6%), Other computer jobs (+24.4%). Secretaries and general office clerks, which moved by similar numbers in opposite directions, and a catch-all business occupation whose series jumps several-fold, are left out of these examples as likely coding shifts. Young workers: the household survey gap in the most exposed quarter of occupations matches payroll data showing employment of ages 22 to 25 in the most exposed jobs 19% below less-exposed peers (August 2026), while the whole occupational mix shows no clear AI footprint (Stanford, Yale Budget Lab).
The answer at a glance #
Every bubble is an occupation sized by its jobs; hollow bubbles moved by less than the survey can detect. Click one to open its page, or open it full size.
Is yours one of them? #
Search 513 occupations by title or by common job titles. Find your job shows pay and exposure scores and up to ten matches.
Exposure alone does not decide it. 13% of exposed occupations fell beyond the noise against 7% of low-exposure ones (17 of 135 against 27 of 378, a difference of about 1.7 standard errors), and similar shares rose (15% against 16%). Across occupations, weighted by jobs, the correlation between exposure and employment change is 0.04. In BLS's own categories, "very high" exposure changed +3.6% and "low" -1.6%.
Why medium. The household survey is large for groups and small for single jobs, so most occupations sit within the noise; the exposure scores date from 2023; and no source here isolates cause.
What would change our mind #
Each question names the next dated event and the page that tracks it.
- Will the gap for young workers in exposed jobs keep widening? : BLS Employment Situation report for October 2026, then the Census October 2026 microdata file, Nov 6, 2026. Tracked onYoung workers in exposed jobs .
- Will employers keep citing AI as the reason for layoffs at this year's pace? : Challenger, Gray and Christmas report for October 2026, Nov 5, 2026. Tracked onYoung workers in exposed jobs .
- Will exposed jobs keep pace as new months arrive? : Census October 2026 CPS public-use file (oct26pub), after the November 6, 2026 jobs report, Nov 2026. Tracked onWhere AI exposure meets falling employment .
- Will BLS move more occupations into projected decline for AI reasons? : BLS 2026-36 Employment Projections, which BLS says will be released in 2027, 2027. Tracked onWhere AI exposure meets falling employment .
- Will the next usage data show more automation-type use of AI? : Next Anthropic Economic Index release (earlier releases: 2026-01-15, 2026-03-24, 2026-06-26); checked monthly, no date announced. Tracked onAugment or automate .
All five are on Open questions.
The evidence #
Where exposure meets falling employment
Where AI exposure meets falling employment computes the answer: 135 exposed occupations, 17 that fell and 20 that rose by more than the noise, and the checks against the years before ChatGPT and the BLS exposure categories.
type: bar
title: Employment change by exposure quartile (percent)
x: quartile
y: [before, after, latest quarter]
height: 280
data:
  - quartile: "1 least exposed"
    before: -3.0
    after: 0.4
    latest quarter: -0.4
  - quartile: "2"
    before: -2.1
    after: 5.6
    latest quarter: 6.4
  - quartile: "3"
    before: 1.9
    after: 3.9
    latest quarter: 1.4
  - quartile: "4 most exposed"
    before: 3.1
    after: 3.3
    latest quarter: 3.6
"before" compares November 2021 to September 2022 with November 2018 to September 2019; "after" compares November 2025 to September 2026 with November 2021 to September 2022; "latest quarter" is July to September 2026 against July to September 2022. Before and after use the 511 occupations that can be traced back to 2019. Standard errors are about 1 point for each bar.
Young workers in exposed jobs
Young workers in exposed jobs sets the household survey next to the payroll studies, the broader labor-market studies and employer statements. The narrow finding that holds up: employment of workers aged 22 to 25 in the most exposed jobs is weaker than elsewhere, in three sources that use different data.
Augment or automate
Augment or automate splits exposed jobs by whether AI use leans toward automation or augmentation: the automation-leaning group changed -2.2% and the augmentation-leaning group -2.2%.
Who is exposed
Occupations has the exposure and employment change for each of 22 major groups, and a page for each of 241 occupations. BLS Employment Projections 2025-35 and AI (August 27, 2026) and BLS AI exposure categories (August 27, 2026) give the BLS view for 2025 to 2035.
What changed #
Earlier claims are struck through and replaced, each with its date and source. The full list is on Old claims and what replaced them.
- Oct 26, 2026, this wiki: the employment data moved from the BLS employer survey (OEWS, May 2022 to May 2025) to the Census household survey through September 2026, which is monthly and current.
exposed jobs grew 1.9% from May 2022 to May 2025 against 6.6% for the rest, and 74 exposed occupations lost 1.63 million jobsreplaced by exposed jobs +2.8% against +3.7% for the rest (the year to September 2026 against the same months of 2021-22), with 17 exposed occupations falling by more than the noise (1.68 million fewer jobs) and 20 rising (2.37 million more).Current answer: not yet across the economy, with early signs in office and customer-service work and among young workersreplaced by the answer above. Source:How this wiki was built . - Aug 12, 2026, Stanford payroll study:
a 13 percent relative employment decline for ages 22 to 25 in the most exposed occupations (Aug 26, 2025)replaced by 19%, with data through June 2026. Source:Canaries in the Coal Mine (Stanford, 2025 and 2026) . - Jan 2025, World Economic Forum:
83 million jobs lost and 69 million created by 2027 (May 2023), which had replaced85 million displaced and 97 million created by 2025 (Oct 2020), replaced by 92 million displaced and 170 million created by 2030. Source:Future of Jobs Report 2025 (World Economic Forum) . - 2016, OECD:
about 47 percent of US employment at high risk of computerisation (Frey and Osborne, Sept 2013)replaced by 9% of jobs automatable on average across 21 OECD countries, from a task-based method. Source:The Risk of Automation for Jobs in OECD Countries (OECD, 2016) . Checked against the data: the 200 occupations the 2013 table puts at 0.7 or higher changed -0.6% from 2021-22 to the year to September 2026 against +2.4% for all matched occupations (Old claims and what replaced them ). - May 9, 2025, Klarna:
its AI assistant did the work of 700 customer service agents (Feb 2024)replaced by recruiting human customer service staff again. Source:Entrepreneur .
Explore the wiki #
- Look up a job:Find your job .
- Browse:Occupations (241 occupation pages in 22 groups),Studies (15 studies and reports),Open questions (5 open questions).
- Analysis:Where AI exposure meets falling employment ;Young workers in exposed jobs ;Augment or automate ;Old claims and what replaced them .
- Interactive pages:Exposure and jobs map ;Find your job ;Exposed jobs that gained and lost .
- Groups:Management ,Business and Financial Operations ,Computer and Mathematical ,Architecture and Engineering ,Life, Physical, and Social Science ,Community and Social Service ,Legal ,Educational Instruction and Library ,Arts, Design, Entertainment, Sports, and Media ,Healthcare Practitioners and Technical ,Healthcare Support ,Protective Service ,Food Preparation and Serving Related ,Building and Grounds Cleaning and Maintenance ,Personal Care and Service ,Sales and Related ,Office and Administrative Support ,Farming, Fishing, and Forestry ,Construction and Extraction ,Installation, Maintenance, and Repair ,Production ,Transportation and Material Moving .
- Methods:How this wiki was built covers sources, the noise rule, what the data can and cannot show, and known gaps.