TL;DR #
SigNoz Cloud rebuilt the trace detail view for engineers to investigate AI-scale traces faster.
The SigNoz Cloud flame graph renders 100,000 spans in a single load and supports million-span traces. The SigNoz Cloud waterfall lists unlimited spans and now loads them faster. New filters and search help users cut through large traces. One click surfaces LLM calls and errors.
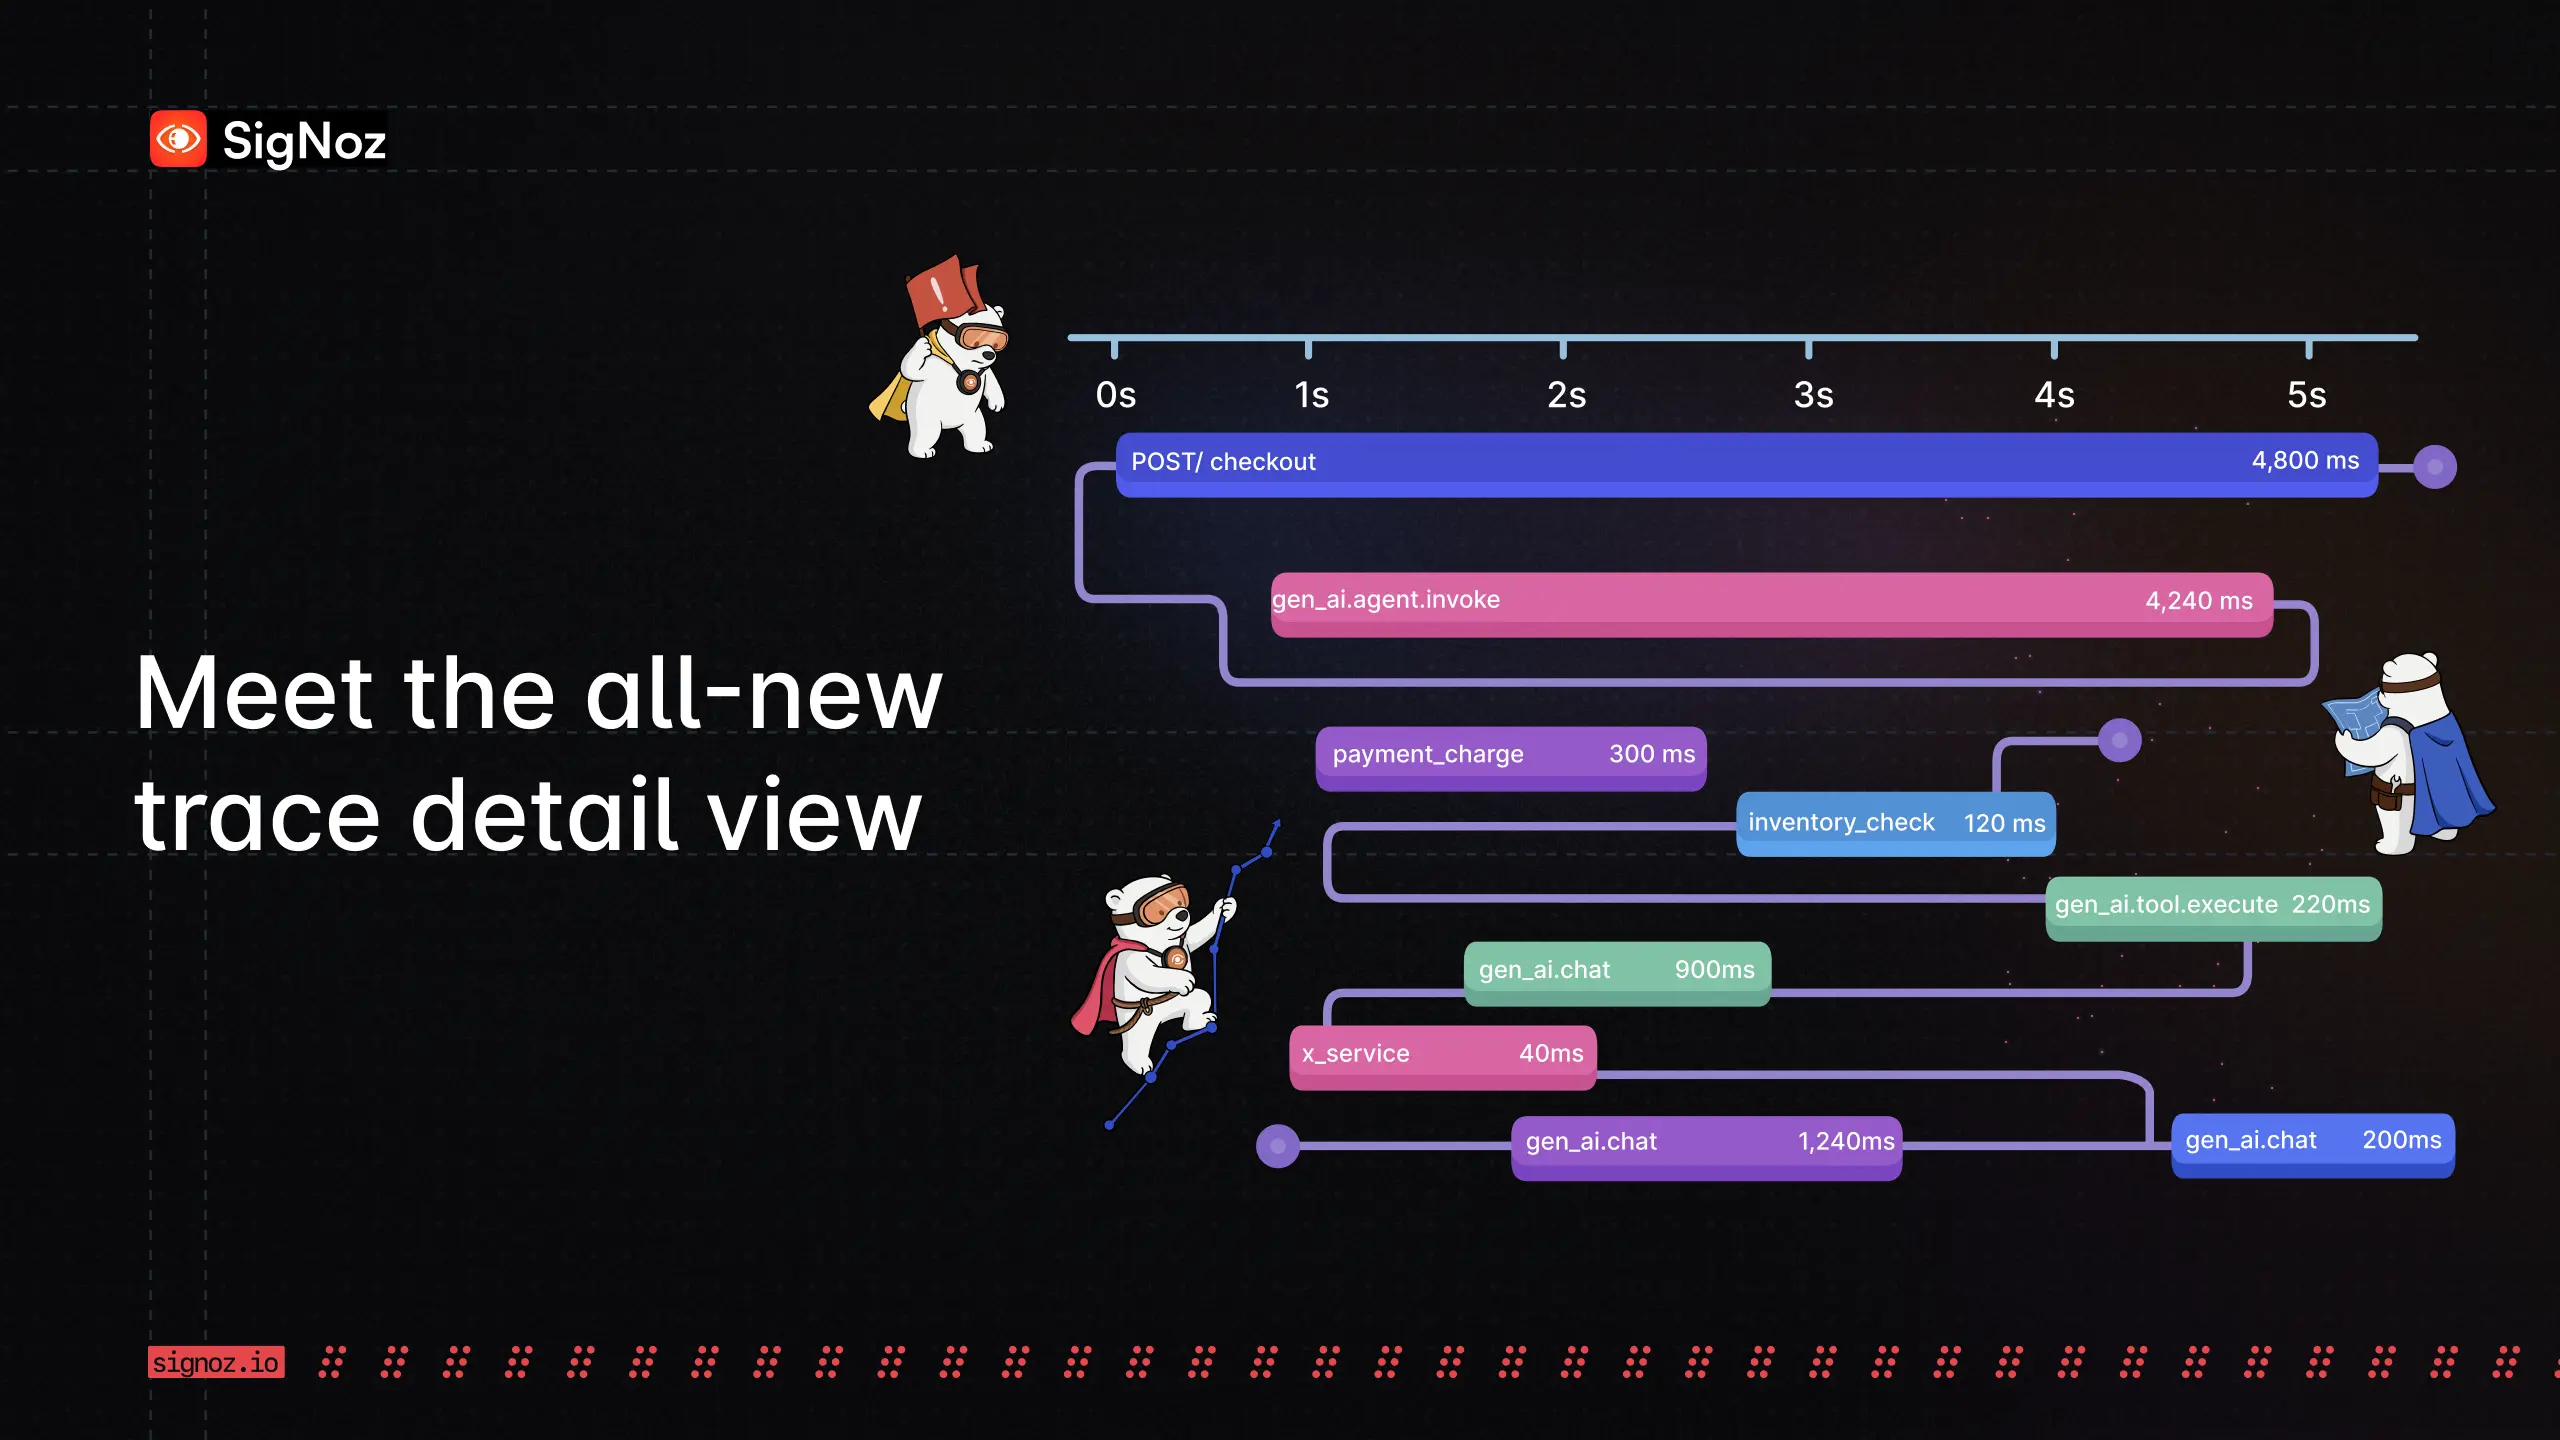
We've rebuilt the trace detail view from the ground up to spot the failing span in million-span traces at a glance. Designed for AI-scale telemetry. The flame graph, waterfall, search, and span details panel are all new.
The trace detail view is where engineers investigate requests end-to-end. They view the full execution path, inspect spans, identify where time is spent or errors occur, and jump to related logs and metrics.
AI workloads have blown up span counts. Agent workflows and LLM calls fan out into many spans, and multi-agent chains multiply that, so one trace can now hit hundreds of thousands of spans. That scale needs a new trace view.
On SigNoz, AI-native teams already generate 2.4x more telemetry.
What's new in the trace detail view #
A flame graph that renders 100,000 spans in a single load
The new SigNoz Cloud flame graph renders 100,000 spans in a single load and supports million-span traces. In one glance, you see the full request path and where time is spent across the trace.
The SigNoz Cloud flame graph uses virtualized rendering, so panning across hundreds of thousands of spans stays smooth.
We've added drag and zoom. Use a trackpad or pinch gesture to move from the full trace down to a single span. The timeline rescales as you zoom. Spans that were barely visible at full view become easy to inspect. A 2ms
span inside a 4s
trace stays accessible.
Unlike Datadog, the visualization holds up at any scale. In Datadog, once a trace exceeds 100 MB it drops to a preview mode where the flame graph is unavailable and the waterfall shows only the most critical spans.
SigNoz Cloud keeps both the flame graph and the waterfall, however large the trace. Beyond 100,000 spans, the flame graph shows a sampled view of the important spans.
A waterfall that lists unlimited spans
The new SigNoz Cloud waterfall loads unlimited spans much faster and stays in sync with the flame graph.
SigNoz Cloud already supported unlimited spans. This update cuts memory allocation by 75% to make faster. For traces under 10,000 spans, the waterfall loads them all at once.
Click any span in the flame graph, and the waterfall expands its subtree and scrolls to it. Use the flame graph to find where to look, then the waterfall to read the sequence of service calls around that span.
Deep traces used to be a problem. When a span sat far down the tree, its details got cut off because the nesting pane didn't adjust. Now the nesting is responsive. However deep a span sits, the waterfall scrolls to it and shows its full details.
For traces over 10,000 spans, the waterfall paginates 500 at a time and still shows every span, unlike Datadog. Even a million-span trace is fully explorable.
Filter, search, and highlight across large span volumes
SigNoz Cloud has updated filter and search in the trace detail view to help you find the span you need in million-span traces.
Filter spans by category with a single click, including database calls, functions, HTTP requests, and jobs. For more specific searches, use the search bar to query one or more span attributes and show only the matching spans.
One customer's GraphQL API returned HTTP 200
even on failed requests, so the status code didn't flag the failed spans. They needed to find the spans with an exception inside by searching the error message. That's where query-based search helps.
SigNoz Cloud has also updated color coding in the trace detail view. Red is now reserved for error spans. Turn on Highlight Errors
and every error span stays red while the rest fade, so failures stand out even in dense traces. You can also color spans by service or host.
Dock the span details panel where you work
Once you land on a span, the span details panel is where you read its data, like attributes, events, and correlated logs and metrics.
We've updated the docking. Now you can dock the panel to fit how you work. Pin it to the right, drop it to the bottom, or float it and move it around, like your browser dev tools.
We've also updated the attributes view. Attributes now come in two views, structured and raw JSON.
SigNoz Cloud has a unified backend for logs, traces, and metrics. Together, these updates make trace investigation smoother, even for very large traces. Find the span in the flame graph, inspect it in the waterfall, and view correlated logs and metrics without leaving the workflow.
All of this works with no extra setup. Grafana, by contrast, needs a one-time setup to link Tempo to Loki, map labels, and tune a time-shift window.
Isolate the LLM calls in a trace
SigNoz Cloud has added a dedicated filter for LLM calls. Click it, and you get a view of every LLM call in the trace. Click any LLM span to expand its nested calls and open the span details panel. Go through the agent flow and read LLM-specific attributes, like model name and tokens.
In the next section, you'll see what we're building next for LLM observability.
What's next in the trace detail view #
A dedicated span details card for LLM calls
We're building a dedicated span details card for LLM calls, so the signals that matter for agentic workloads are right up front. When you select an LLM span, you'll get a new view where model name, token usage, latency, and cost sit at the top.
A minimap for flame graph zoom
We're adding a minimap to the flame graph, so you always know where you are as you zoom into a large trace and can navigate it easily.
Get Started with SigNoz #
If you're struggling to render or investigate large traces, SigNoz Cloud is one of the few tools that keep the flame graph usable and show the full span list in the waterfall, even for million-span traces. Traces, logs, and metrics live in one OpenTelemetry-native backend, so you can move from a trace to its logs and metrics without switching tools. The best way to start is SigNoz Cloud. You get 30 days of unrestricted access to every feature, and our team can help you onboard or migrate your existing setup.
If you prefer to keep your data in your own environment, SigNoz is also available as a self-hosted Enterprise edition (BYOC or on-premises) and as the open-source Community edition. Note: Datadog and Grafana details in this post were verified against their public documentation in August 2026.