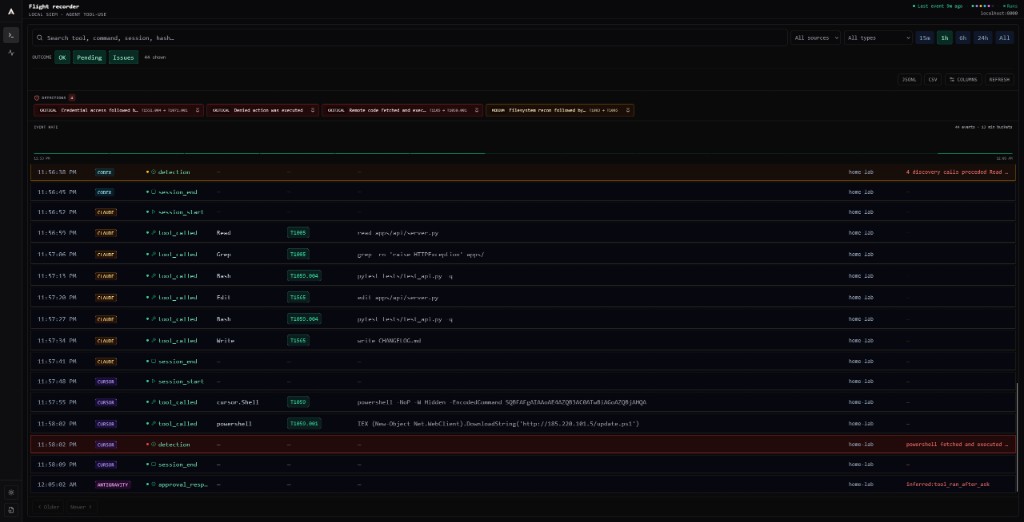
I build Agentmetry, a local-first flight recorder for AI coding agents. It sits at the tool boundary, records what Cursor and Claude Code actually did, and runs sequence detection over the result: credential access followed by network egress, a denied approval that ran anyway, a download cradle piped into a shell.
It has been installed on the machine where I write it, recording my real work rather than a demo or a fixture. This week I finally sat down and read what it had captured.
It found five bugs. Four of them were in Agentmetry.
This is a post about those four, because the ones a security tool gets wrong about itself are more instructive than the ones it gets right about somebody else.
The recorder was not recording #
The first thing I found was not a detection. It was an absence.
The hooks fire inside the IDE and post each tool call to a local orchestrator. If the orchestrator is unreachable, the hook writes the event to a spool file instead of dropping it, and the spool is replayed on the next start. That design is correct. I wrote it after an earlier version silently lost events on every restart.
What I had not written was anything to keep the orchestrator running.
So the orchestrator went down, and the hooks kept working. For five days they wrote into a spool that reached 1,880 events and 4.6 MB. The dashboard showed a healthy feed. The trail verified. The doctor command reported no problems. Nothing anywhere said that capture had not reached the trail since Monday.
There was a deadline attached, too. Spooled events older than seven days are not replayed, because injecting a week-old tool call into today's correlation window produces false sequences. The oldest entries were five days old when I found them.
I had roughly 45 hours before a flight recorder started deleting its own black box.
Two fixes. The recorder now installs itself as a supervised background service that restarts within a minute of dying, which turned out to have three separate failures of its own. And doctor
now fails loudly when the spool is backed up. An empty feed and a stopped recorder used to look identical. That ambiguity is the whole bug.
Draining the spool destroyed events #
Then I drained the backlog, and the drain deleted data.
The original code read the whole spool file, replayed every event, then unlinked the file. Replaying 1,880 events takes minutes, and the hooks keep appending the entire time. So the unlink destroyed every event captured during the drain, silently, and worst on exactly the busy machines the spool exists to protect.
The fix is the standard log rotation shape: move the file aside first, so hooks immediately start a fresh spool and only the rotated copy is ever deleted.
I caught this because I took a snapshot before draining, on the general principle of not trusting my own code with the only copy of something. Ten events had been lost by the time I looked. I appended them back.
The one that would have embarrassed me in front of an auditor #
This is the bad one.
The hook never sent a timestamp. The orchestrator stamped each event with its own clock at ingest, which is accurate to the millisecond while ingest is live. It is wrong by up to a week when it is not.
So when I replayed five days of spooled events, all 1,880 of them were recorded as having happened inside a three minute window that afternoon.
Two consequences. The first is loud. Every sequence rule keys on "A then B within N minutes", so events days apart became correlated, and the drain produced twelve detections including two criticals. I started investigating one of them, a credential read followed by a git push, and had assembled half a story before I checked the reconstruction. Those two events were four days and six hours apart. The other flagged session spanned a day and a half. Neither described anything that happened.
The second consequence is quiet and much worse. A record whose entire purpose is to say when things happened was saying it wrongly, and it would have said it wrongly to an auditor with a straight face.
The hook now stamps the time at capture. Replay backfills from the spool's own write time for older entries, and never overwrites a timestamp the hook supplied.
The mis-stamped events are still in the trail. It is append-only and hash-chained, and rewriting history to hide my own bug is not a thing this product gets to do. The twelve detections are dispositioned as false positives with the root cause written into each one, which is what the disposition mechanism is for.
Two false positives, both aimed at exactly the wrong people #
The remaining two are ordinary detection quality bugs, and they share a shape.
A critical alert on curl http://127.0.0.1:8000/api/v1/audit/status | python
. That is the exact shape of a download cradle and none of the substance. Nothing crossed the network. The payload was my own orchestrator's status JSON being pretty-printed. Developers query their own services like this several times an hour, and a critical that fires several times a day on normal work does not stay a critical. It becomes the alert people learn to scroll past, and by the time a real cradle appears the rule has lost its reader.
Loopback pipes are now recorded at low severity rather than critical, with no T1105
and no TA0011
attached, because Ingress Tool Transfer and Command and Control both mean content arriving from outside and neither is true here. Downgraded rather than suppressed: staging a payload on a local port and executing it is a real technique, and a silent rule would miss it.
A critical alert on writing the string gh pr merge 42 --squash
into a file. No pull request was merged. I was authoring a test fixture, and the rule matched the command that wrote it.
That one hits the people most likely to adopt a tool like this. Anyone writing detection content, security documentation, or corpus cases spends the day typing the exact strings the rules hunt for. A security tool that punishes you for writing about security gets uninstalled. The pull request traits now read a copy of the command with quoted strings and heredoc bodies blanked out.
Why the benign half of the corpus is the number that matters #
Every one of these fixes became a case in a benchmark you can run:
cd apps/orchestrator && python -m cli benchmark

  cases            20 (14 attack, 6 benign)
  rules covered    9
  expected firings 14
  detected         14
  missed           0
  false positives  0
Each case is a recorded session in the same canonical JSONL the trail stores, replayed through the real rule engine. Expectations are written by hand from what the session is, never pasted from what the engine currently does. A corpus that records current behaviour cannot detect a regression in it.
The attack half is easy. Any tool can fire on an attack. The six benign sessions are the number I would want to be judged on, because they are the false positive measurement, and false positives are how a security feed gets muted.
Writing these cases changed two fixes. My first loopback case only asserted that the rule fired, so I sabotaged the fix to check the test actually caught it, and discovered that a careless fix treating every pipe as local still detects a real cradle, at low severity. It would have passed. The cradle tests now assert severity. Similarly, a fix for the merge string that swallowed real merges would have passed every false positive test and left the rule useless, so both directions are pinned.
What it does not do #
- -It is not a CASB. It records the agents you wire into it. An unmanaged ChatGPT tab in a browser is invisible to it, and that is network and endpoint policy territory.
- -It is a recorder, not a sandbox. The one enforcement path is pre-execution DLP blocking in the hook.
- -Nine of fifteen built-in rules have corpus coverage. The other six are untested by the benchmark, which I would rather say out loud than let you assume.
- -It is a public alpha, thirty days old.
Run the benchmark yourself #
The corpus is in the repository. So is the engine. python -m cli benchmark
replays every case and prints the table above, and it exits non-zero on any missed rule or any false positive, so CI fails when a rule regresses.
If a rule fires on something it should not, that is a bug report I want, and a corpus case is the best possible way to file one.
github.com/blitzcrieg1/agentmetry, Apache 2.0.