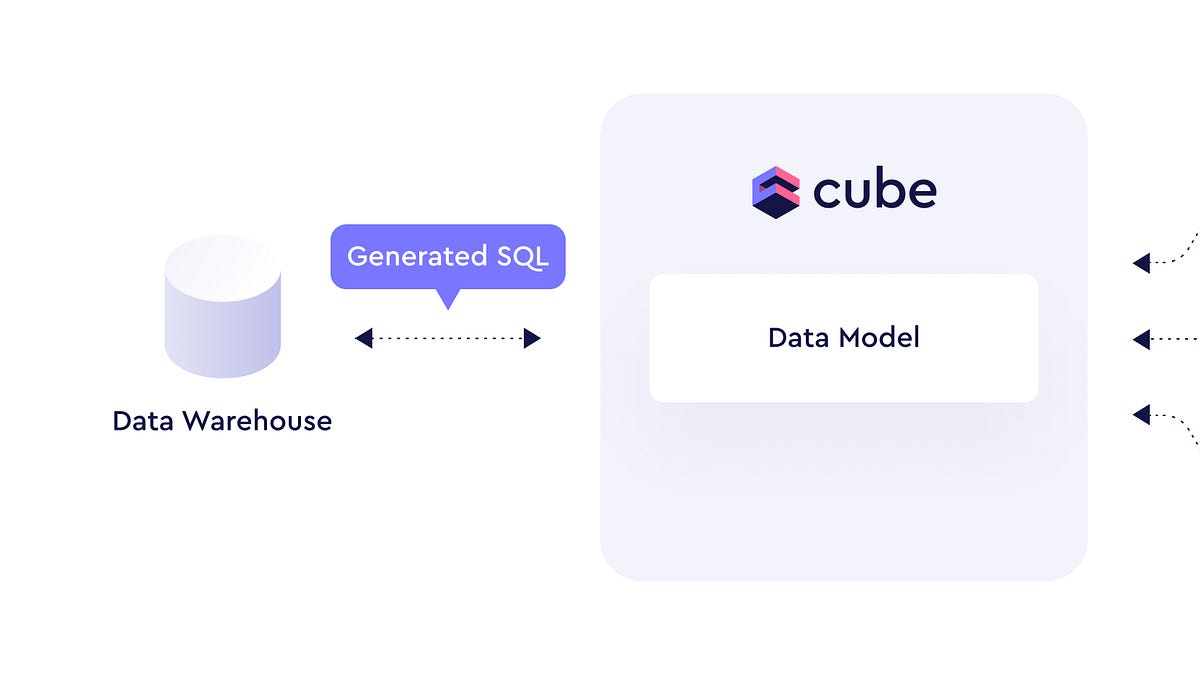
We put Cube.dev through its paces against AWS Athena — modeling 27 tables, breaking the semantic layer on hard measures, building dashboards, and testing its AI agents
Disclosure: Strata competes with Cube — we're building a semantic layer of our own — so treat this as an informed but interested take. Our sharpest criticisms (the view layer as an access point, and pushing calculations to runtime instead of the model) happen to be areas where we've made a different design bet. That's not an accident, and you should weigh it accordingly. The goal of this series is to understand the market and bring you along
Disclosure: Strata competes with Cube — we're building a semantic layer of our own — so treat this as an informed but interested take. Our sharpest criticisms (the view layer as an access point, and pushing calculations to runtime instead of the model) happen to be areas where we've made a different design bet. That's not an accident, and you should weigh it accordingly. The goal of this series is to understand the market and bring you along
Getting Started #
This was going to be a pure semantic layer as middleware review of Cube. But it turns out Cube has evolved (pivoted?) to include workbooks, dashboards, and AI chat interfaces. They are basically a full BI solution now.
Read my recent gloating on how this was inevitable and correct.
For the semantic layer we used the open source package via docker. Simple docker run command and your off to the races. When you access the UI it walks you through the process of connecting your database and generating models with default configurations from your db. The models are defined in YAML files or Javascript. We opted for YAML. These files are mounted in your local directory and you can directly edit them from any IDE. After an edit the model is instantly available on the server. No long setup process. No user account management barriers. No edit → deploy cycles. You go from docker run to seeing your models in the UI rapidly.
While this is great we did wonder about the ability to have multiple branches in production. This becomes important during migrations or major changes. There is no built in test automation for the models. Versioning will exclusively be done via git.
Once your model files are created they are instantly accessible in the playground UI. This is where we did most of our semantic capabilities test. I believe the semantic layer in the open source version and cloud are identical in capabilities.
Note on Cube Cloud
We did not use the cloud version for model development. Cloud has an IDE environment to edit and manage your model files. Additionally, as far as we can tell the Cube CLI is meant to deploy local projects to the cloud. No additional functionality was reported on the doc sites.
Review Setup
We are testing Cube and other BI tools against our AWS Athena data warehouse. Its loaded with a small sample size TPC-DS data model. Our objective with this review and other BI tool reviews is to see how much self service can be enabled for non technical users. How many personas are involved in maintaining this tool in a well functioning analytics deployment?
Semantic Layer #
There are two types of main model files in Cube: Cubes and Views. Cubes tend to map one to one with a table. However, it is possible to model multiple cubes in a single model file. I would assume best practice is one model file equals one table in the target database. Views reference cubes to create a curated access layer for users to interact with the underlying models. This is similar in functionality in many ways to how Looker models and explores work.
Here is a truncated cube definition for our * catalog_sales* fact table:
cubes:
  - name: catalog_sales
    sql_table: tpcds.catalog_sales_new
    data_source: default

    joins:
      - name: date_dim
        relationship: many_to_one
        sql: "{CUBE}.cs_sold_date_sk = {date_dim}.d_date_sk"
...

    dimensions:
      - name: cs_order_number
        sql: cs_order_number
        primary_key: true
        type: number

    measures:
      - name: catalog_sales_count
        type: count

      - name: cs_quantity
        sql: cs_quantity
        type: sum

...
A cube model consists of joins, measures, dimensions, and any pre aggregations ( more on this later ). Joins here are meant to be a path length of one. I.e. from fact table to a dimension table. At query time it will resolve full join paths up an entire hierarchy (table a → table b → table c …). When you have join path ambiguity or any issues in join construction you need to use a view to resolve.
We manually modeled a handful of tables and then used Claude to create the rest using an existing Strata model as a template. This went pretty fast for about 27 tables total. Once this is done you can use the playground UI to build and execute queries. One thing to note at least in this UI, there is no awareness of what a legal query is. * You can easily create illegal queries and get a “can’t find join path” error. * We will explore query building in more detail in the Dashboards section below.
Cross Domain Data Blending
Cube call these multi fact views. As you guessed you need a view for every combination of cross fact queries. Although the docs recommend only adding facts with common dimensions it is possible to add unrelated dimensions. Obviously, this will cause your views to end up with unresolvable join paths. In practice, this means you cannot mix granularity in the view definition.
You must run Cube v1.7.0 or higher with Tesseract enabled for multi fact view functionality.
This architecture guarantees an explosion in views. Views are the entry point so it also adds another hurdle for non technical users. * “Which view has the set of dimensions and measures I need?”* Agents will struggle here as it is very likely that overlapping views will come to exist. We think this experience will be very similar to Looker. Some orgs will find this an acceptable trade off while others will struggle. Once you start getting into the dozens of views, maintenance will become a burden. You are also guaranteeing that data engineering is frequently in the loop of building and creating views. Overall, this is a technical weak point of Cube and Looker.
Don’t mean to pile on here but the query generated for multi fact joins appear over engineered. Its possible they are targeting more databases and maybe some don’t support full joins. In anycase, our db does but they are manually simulating a full join. This is a nit, we know, but an unnecessary hit to performance.
Measures
Simple measures are straightforward to implement. You provide an sql expression and agg function and your good to go.
    - name: cs_net_paid
      sql: cs_net_paid
      type: sum
We like to jump to the hardest cases to really stress test an engine. Let’s start with semi-additive measures like balances and inventory counts. These measures typically land in snapshot tables with daily, weekly, or other frequency. We couldn’t find any documentation so assumed its not a feature. However, with the help of Claude we were able to simulate it:
     - name: qoh_last_snapshot_sk
        sql: inv_date_sk
        type: max
        public: false

      - name: qoh_snapshot_recency
        multi_stage: true
        type: rank
        public: false
        order_by:
          - sql: "{qoh_last_snapshot_sk}"
            dir: desc
        reduce_by:
          - inv_date_sk

      - name: qoh_end_of_period
        multi_stage: true
        sql: "{inv_quantity_on_hand}"
        type: sum
        add_group_by:
          - inv_date_sk
        filters:
          - sql: "{qoh_snapshot_recency} = 1"
        description: >-
          Semi-additive ending balance: quantity on hand on the last snapshot
          date within the reporting period (works at month/quarter/year grain).
This is great but not well documented. It did produce a gnarly 176 line SQL code for a simple monthly inventory on hand report but the results do look right. While a more complex implementation than Power BI, it’s great that Cube has this capability. Many real world data models have non additive metrics.
Next, let’s look at complex measures. Those that can reference other defined semantic measures in the same cube or related cube (via join). In Cube these are called “Calculated Measures.” The level of complexity enabled is limited to measures in cubes that are directly joinable and cannot include dimensions. To be fair Claude suggested that dimensions can be added in non calculated measures with an aggregation type. But, we didn’t see that in the docs. Here is what our actual calculated measure looks like:
      - name: net_paid_per_quantity
        title: Net Paid per Quantity
        sql: "{cs_net_paid} / NULLIF({cs_quantity}, 0)"
        type: number
        format: currency
SQL generated here is exactly as expected.
Cube also supports embedding rolling window calcs at the measure definition level. This is done using the rolling_window
param. You could also use the sql
param
and set window function manually in SQL. In general, we think windowing of measures should be a runtime action by the end user not a semantic layer primitive. When there are hundreds of KPIs whose windows must be defined at the semantic layer, the maintenance overhead becomes untenable.
How about** level of detail metrics**? Ones where we can selectively include or exclude dimensionality. Cube has answers for this via grain
and multi-stage
measure types. Here is an example of creating Catalog Net Paid across all items and brands:
- name: cs_net_paid_ignore_item_brand
  title: Net Paid (ignoring Item & Brand)
  sql: "{cs_net_paid}"
  type: sum
  multi_stage: true
  grain:
    exclude:
      - item.i_item_id
      - item.i_brand
This means if item and brand are in the query, it will create a subquery without them in the group by. The use case is to rollup net paid to the category or higher levels. You could then use this measure in percent of total calculations. Measures like these are quite easy to define and self explanatory for the most part. You can also selectively include or exclude filters by using the filter param with multi-stage. It’s a bit more complex, but this is the case in most semantic layers.
The only issue with this measure and measures in general is the overly complex queries cube is generating. Here is the query for Item Category, Item Brand, Net Paid (the one defined above):
WITH cte_0 AS (
  SELECT
    "item".i_category "item__i_category",
    "item".i_brand "item__i_brand",
    sum("catalog_sales".cs_net_paid) "catalog_sales__cs_net_paid"
  FROM
    tpcds.catalog_sales_new AS "catalog_sales"
    LEFT JOIN tpcds.item AS "item" ON "catalog_sales".cs_item_sk = "item".i_item_sk
  GROUP BY
    1,
    2
  ORDER BY
    3 DESC
),
cte_1 AS (
  SELECT
    "fk_aggregate"."item__i_category" "item__i_category",
    "fk_aggregate"."item__i_brand" "item__i_brand",
    sum(sum("fk_aggregate"."catalog_sales__cs_net_paid")) OVER (PARTITION BY "fk_aggregate"."item__i_category") "catalog_sales__cs_net_paid_ignore_item_brand"
  FROM
    (
      SELECT
        *
      FROM
        cte_0 AS "cte_0"
    ) AS "fk_aggregate"
  GROUP BY
    1,
    2
  ORDER BY
    3 DESC
)
SELECT
  "fk_aggregate"."item__i_category" "item__i_category",
  "fk_aggregate"."item__i_brand" "item__i_brand",
  "fk_aggregate"."catalog_sales__cs_net_paid_ignore_item_brand" "catalog_sales__cs_net_paid_ignore_item_brand"
FROM
  (
    SELECT
      *
    FROM
      cte_1 AS "cte_1"
  ) AS "fk_aggregate"
ORDER BY
  3 DESC
LIMIT
  10000
This is a simple case but as you layer on more measures and complexity it will get much harder to debug. Claude can probably figure it out though, hopefully.
Finally, Cube supports the creation of time shifted measures, percent of total measures, and conditional measures. We believe time shifted and percent of total should simply be runtime enhancements of existing measures. Same as we suggested for windowed measures. Imagine having 30 KPI’s and having to define every possible windowing, time shifting, and percent of totaling calculation ahead of time.
Semantic Layer Summary
Overall, Cube is a capable semantic layer. Easy to model and deploy with the help of the latest LLMs. And it has a range of measure and query features that enterprises have come to expect. Even semi additive measures were doable although a bit clumsy.
However, there are several short falls worth considering:
The need for a View layer as an access point
This adds another point of maintenance that tries to make up from the query engines inability to resolve certain classes of queries
Number of views will explode as it becomes a crutch for solving common query needs
Multi fact queries need a view for every combination of use cases
Complex setup for semi additive measures (not officially documented)
Windowing and time shifting measures as a primitive rather than a runtime enhancement
Building Dashboards #
Dashboards are only available in the Cube cloud product. You can sign up for free and take the tool for a test drive. The signup process was smooth but getting my local Cube core project into the cloud and on the master branch took some effort. Once the basic setup is done you can launch the main app. Here you are greeted with the typical chat box experience that’s seen everywhere. If you are an experienced data pro like us, your first reaction might be skepticism (see AI section below).
You can skip the chat box by clicking on create workbook button on the top right. Here the user has to make their first decision. The one we’ve been foreshadowing for much of this article. **Which “view” has the stuff I need? **Selecting a view will launch the workbook experience. This is sort of the usual tabbed layout style seen in Tableau and elsewhere. However, instead of drop zones, they deploy a click to place style UI like Looker. I find this style unintuitive in the post Tableau drop zone world. I suppose we can skip that and use the chat assistant (right dock).
Using the assistant you can chat your way into multiple tabs and a complete dashboard layout. Of course, you have to give specific instructions and this does take some time to resolve. Alternatively, you can use the explorer bar to construct your query. Generally, the workbook UI is similar to the playground UI of the open source Cube core version but with many more features including charting. And similarly there is no guards preventing from the “there is no join path” error. Users will have to know what legal queries can be derived from the current view or discover that via trial and error. Same goes for agents.
By default a configured workbook tab renders results in tabular mode. You can click on chart → settings to configure a specific chart layout. They offer many of the common chart types and an “html” one. The latter not being so common. It looks like you can use custom css and html with handlebars templating engine to create something unique. We did not try this. Lastly, we did not see a way to add custom derived calculations. However, adding totals and subtotals were possible.
Once you have a handful of views you can go to the dashboard builder. The dashboard layout creation is manual with a snap to grid style UX. Dashboards are rendered full width so you should be mindful as you layout the various charts. This is by far from pixel perfect style dashboard creation. It’s more of a quick and easy creator with some layout flexibility.
Interactive filters are created at the dashboard level not workbook. You can choose which charts are targeted and place the filter control where you like. One of the interactive controls is a Time Granularity control. We could not get it to work but have a sense for what it’s meant for. I think a control like this works better at the individual chart level rather that at the global dashboard level.
Overall the dashboard building experience is a bit clunky but it gets the job done. We should give Cube some grace here as it’s a new product and will likely be markedly improved over the coming years. With this feature, Cube now allows data engineers to go from semantic modeling all the way to delivering interactive dashboards.
Performance #
Cube store is the primary way to speed up queries. You define it as a pre-aggregation node in your cube definition file. The aggregation level could be set by any dimensionality along the join path of the cube. Its designed to be partition aware based on a referenceable time dimension in the current cube or to a joined cube. Cube store is a proprietary OLAP engine built using parquet file formats. This means access to this store is exclusively via Cube API’s.
Cube also supports pre-aggregation within your target datasource. For example, instead of into the cube store, the aggregation will just be a table in the same datasource as the cube. This is probably not going to get you subsecond performance but could be handy in some scenarios.
Queries are routed to the store if the query criteria falls within the partition and all members are available. You can easily setup refreshes of the pre-aggregation via refresh key. Here is what our pre agg definition looks like:
      - name: store_sales_by_store_month
        measures:
          - CUBE.ss_net_paid
        dimensions:
          - store.s_store_id
          - store.s_store_name
       ...
          - date_dim.d_month_seq
          - date_dim.d_quarter_seq
        time_dimension: date_dim.d_date
        granularity: month
        partition_granularity: year
        refresh_key:
          every: 1 day
        build_range_start:
          sql: SELECT CAST('2024-01-01' AS TIMESTAMP)
        build_range_end:
          sql: SELECT CAST('2026-12-31' AS TIMESTAMP)
For a single chart on our 8.5 billion row table, we were able to achieve query times in the range of 125ms to 775ms. And for 5 charts on a dashboard the whole thing rendered from a full refresh in a little over 1 second. Interactive filtering was quite fast as well. Cube handled our smallish table quite well. We did not stress test it beyond this. This review is not a performance test evaluation. Perhaps we’ll do something like that in the future.
AI Integration #
Cube provides LLM integration out of the box. You do not have to bring your own keys. In fact, I could not find a way to configure a custom LLM model and API. A newer feature we did not test was the ability to define agent skills via YAML files. Similar to how you define a cube, you can define a skill that walks through a set of steps to complete an analysis.
AI agents seem to primarily rely on views that were created. However, there was one case where it seemed to pull directly from the cubes. The quality of the agent performance will come down to the quality and depth of views you create for different use cases.
One of the tests we ran were questions where the correct dimension wasn’t obvious. For example, I asked how is albert clark performing. It was able correctly deduce that Store Manager as the likely dimension and used it to filter. This was an easy guess as we only had one view at the time. Later I asked about this manager again in a new session — with 5 additional views — and this time it was able to use its own memory to recall albert clark as being a Store Manager. This is a really nice capability. It means the agent experience will improve naturally with more use. I wonder if memory is across all users, sessions, and projects. Would be challenging when you have similar values in different dimensions. For example, the country france as Order Country and Ship Country. Finally, when asked about performance of “bracelets” which could fall into one of 4 possible dimensions, it executed dimension value probes. I bet the results go into memory. How big can this memory get? In anycase, dimension value probing is a good utility, but the performance would be terrible going directly against large warehouse tables. Caching via cube store should make this less of an issue.
In general, all AI BI tools struggle with questions that leave out semantic context. Cube solves this by letting the AI direct dimensional probes and storing summaries in its own memory. Most of the issues with Cube’s AI is really just a limitation of its semantic layer as documented above.
Primary Operator #
Most Enterprise productivity software have many personas involved. Some are active while others are passive. This is especially true of Business Intelligence applications. Some users create content and while others simply consume content. The Primary Operator is the active user meant to use the full functionality of the product. They are the users mainly benefiting from a productivity boost. Another way to think about the primary operator is that absent this tool they would still have to complete the task somehow.
Cube is designed for technical users. Even users connecting BI tools will need to know which views to connect and maybe even write semantic sql. The UI experience besides the chat box is much more technical in nature. Assuming you can get past that, a non technical user still will need deep model awareness to effectively use it. They would need to know how to select the right view. They would need to rely on engineers to create custom views for unconfigured data blending use cases. They would have no way to create custom calculations.
No, Cube is certainly an engineers tool. Which makes sense since Cubes adoption in the early days came from engineers. My guess is that the workbook experience will get more data science capabilities in the future. This would further entrench the tool as strong option for data scientists, analytics engineers, and data engineers. Non technical users may get some mileage out of the chat experience but they are likely to remain passive consumers of dashboards.
Summary #
Cube has evolved from a pure semantic layer into a full BI solution with workbooks, dashboards, and AI chat.
As a semantic layer, Cube is capable but has structural weaknesses. Its biggest flaw is the reliance on Views as the access layer: multi-fact queries require a view for every combination of use cases, guaranteeing view sprawl, ongoing maintenance burden, and constant data engineering involvement. A weakness it shares with Looker. Advanced measure types (semi-additive, level-of-detail, calculated) are achievable, but semi-additive measures required an undocumented, clumsy workaround, and the generated SQL is often over-engineered and hard to debug.
The cloud dashboard builder is functional but clunky. A click-to-place UI rather than modern drop zones, no guardrails against illegal queries, and no custom derived calculations. This is forgivable for a new product. Performance via Cube Store pre-aggregations was strong: sub-second query times on an 8.5 billion row table. Needs further testing to see how well this scales.
AI integration is a bright spot, with built-in LLM support (no custom model config, though), dimension-value probing, and cross-session memory that improves with use. However, one should be mindful that agent quality ultimately depends on view quality, inheriting the semantic layers limitations.
**Bottom line: **Cube is a capable semantic layer, but it's built for technical users. It performs quite well as semantic middleware, despite all our grievances with that strategy. But whether accessed as middleware or directly through the cloud, non-technical users remain passive dashboard consumers. So before you adopt it, answer one question: which persona are you trying to enable?