Frontier labs argue for regulatory pacing on safety grounds. Some argue that, without regulatory intervention, we may be months away from a terroristic bioattack, runaway, recursively self-improving and nefariously minded AI, or some unknown but "surely" catastrophic event.
Indeed, many well-intentioned people working inside frontier labs believe that AI poses an existential threat to human life. We do not doubt their sincerity, but those convictions do not make their employers disinterested advisers on the rules governing their own industry.
Without a doubt, safety is the core motive for many researchers and other individuals within the frontier labs, but it is also true that the rules the labs propose protect their investments, preserve price premiums, and defer billions in competitive spending. We do not think anyone should take their case for those rules at face value.
Regulatory coordination gives existing models longer to earn a premium while postponing the next costly investment. At the scale of frontier development, that is an enormous financial incentive. The labs stand to gain from the rules they recommend, so their safety arguments deserve independent scrutiny. In this essay, we will detail exactly what would inspire them to risk potentially heavy-handed regulation from a less-than-friendly administration.
01
Without regulation setting the pace, labs that slow down leave rivals free to race ahead. #
Amodei’s published plan argues for coordinated pacing “without sacrificing commercial advantage.” It calls for government-supported coordination and capability checkpoints, and announces Anthropic’s commitment to embedded independent reviewers with internal access and publication rights.
The proposal also calls for restrictions on Chinese access to compute, unauthorized distillation, and model-weight theft. Amodei describes distillation as a way for lagging companies to catch up at a fraction of the cost of independent development.
Without regulations that all labs can trust all other labs to follow, a lab that slows alone leaves its rivals free to advance, possibly giving up the frontier forever. Binding limits on those rivals make slowing down game-theoretically feasible. That is the financial value of regulatory coordination: it protects a lab’s commercial position by restraining its competitors too.
02
Frontier models lose market share very quickly as smarter, cheaper, newer models are released. #
In the September 13 benchmark, GPT-6 Astra at high effort scores higher than Fable 5 with fallback, yet costs $1.72 per task against $8.75. [2]
When a cheaper model meets the same task requirements, the more expensive model needs another benefit to justify its premium. At unchanged serving costs, a price cut leaves less money from each task to repay the same development bill. Rules that slow the arrival of capable substitutes prolong that premium.
Historical price decline · Through 3 September 2026 · Index v4.1.1
The price of intelligence halves every 46 days.
Each line follows the cheapest way to buy roughly the same benchmark capability after a flagship model launches. Across benchmarked models, the fitted price trend halves in about 46 days.
The problem is that newer models tend to be both more intelligent at their highest settings and cheaper for any given level of intelligence, and switching costs are low, meaning that customers tend to switch their AI usage to the newer model as soon as it rolls out—sometimes more than once in a single week. Slowing the arrival of new models gives labs longer to collect a premium on their existing models.
Compare the 12 model histories #
Artificial Analysis data via CatalystNeuro ↗
Method, model histories & data #
Early prices are partly reconstructed; this is a historical estimate, not a clock for a lab’s revenue or profit. A lower frontier price does not reveal the prices a lab actually realizes across its products. Each line tracks the cheapest available model in a flagship’s five-point score band after its launch, not necessarily that flagship’s own price. Prices are divided by their starting values, so 0.5 means half the original price. Dots mark price events, straight lines connect them, and open circles mark the end of each history. The dotted black line shows the average fitted decline.
The estimate uses five releases with at least 90 days of history. Each release contributes its full history, from 98 to 294 days; the cutoff does not shorten any line. Newer releases are shown with all available points, including the September 1–3 launches. GPT-5 is excluded from the estimate.
We fit an exponential decline to each older release’s daily price history, using log prices and a starting value of 1. We average the five decline rates and convert that rate to a half-life: 45.82 days. The displayed straight segments interpolate between price events.
Three releases in the estimate share the 55–60 score band, so their histories overlap. Five-point bands admit models scoring below the flagship. Requiring a model to match or beat the flagship’s exact score gives a half-life of 50 days; this is a sensitivity check, not an uncertainty interval.
Normalization starts at the cheapest price in the band, even when it is below the flagship’s own price. Before August 19, most prices are later observations dated back to launch, with some known price cuts added. Earlier prices and availability were not fully recorded. Scores use Artificial Analysis v4.1.1: the September 3 snapshot, plus Astra’s launch-day measurements from the September 4 morning archive. GPT-5’s price remains in the market comparison data.
| Full histories in this snapshot | |||
|---|---|---|---|
| Release | Score band | Days | In fit |
| --- | --- | --- | --- |
| GPT-5.1 | 35–40 | 294 | Yes |
| GPT-5.4 | 50–55 | 182 | Yes |
| GPT-5.5 | 55–60 | 133 | Yes |
| Opus 4.7 | 55–60 | 140 | Yes |
| Opus 4.8 | 55–60 | 98 | Yes |
| GPT-5.6 Sol | 60–65 | 56 | No |
| Fable 5 | 60–65 | 86 | No |
| Opus 5 | 60–65 | 41 | No |
| Fable 5.1 | 65–70 | 2 | No |
| Gemini 3.8 Flash | 55–60 | 1 | No |
| Muse Spark 1.3 | 60–65 | 1 | No |
| GPT-6 Astra | 60–65 | 0 | No |
Download the plotted data (JSON) · Benchmark methodology ↗ The current comparisons come from the September 13 Pareto-frontier snapshot, covering 41 configurations on Index v4.3. They measure benchmark performance and task cost; actual customer switching and provider profitability remain unknown. Their raw scores and task costs cannot be compared with the historical v4.1.1 graph. We checked the four configurations cited here against Artificial Analysis’s embedded data. The cost frontier contains 13 configurations from 4 model families. Download that snapshot (JSON).
In the comparison above, Astra at high effort scores 51.05; Fable 5 with fallback scores 49.70. Fable 5.1 at max effort with fallback has the highest score in this snapshot: 53.37 at $7.63 per task. Astra max scores 52.81 at $3.26. Fable costs 2.3 times as much for 0.56 more index points. The benchmark does not establish how much customers would pay for that score difference. Fable 5 uses its reported fallback configuration.
03
Not all AI companies target the same customers, and not all customers support the same economics. #
The market for AI is split into cost-conscious and quality-conscious customers. OpenAI and Anthropic principally target quality-conscious customers, with the caveat that OpenAI has recently been making strides to support cost-conscious customers through its Jalapeño chip development and Luna price cut. Chinese AI providers target cost-conscious buyers.
These two markets have very different dynamics.
Cost-conscious
When several models meet the same requirements, the economic comparison is cost per successful task. In its DeepSeek-V2 report, DeepSeek reported 93.3% less attention-cache memory and up to 5.76 times the text-generation throughput of DeepSeek 67B. The compressed cache lets the hardware serve more requests together.
At unchanged prices, more paid work per GPU-hour raises margins and leaves more of each sale available to recover development spending. Serving cost-conscious customers is a pure optimization game—one that is well understood and can turn traditional engineering work into durable advantages.
Quality-conscious
When cheaper models cannot deliver the required result, additional capability supports a price premium. Building that capability requires investment in research, compute, and training. This is the market that the frontier labs like OpenAI and Anthropic currently dominate.
For quality-conscious models, the main driver of margins is the economic value that a customer can generate per unit of marginal intelligence (let's call it dollars per digital IQ point, for the sake of analogy). The greater the difference between the smartest model and the next best alternative on the market, the greater the premium that can be commanded.

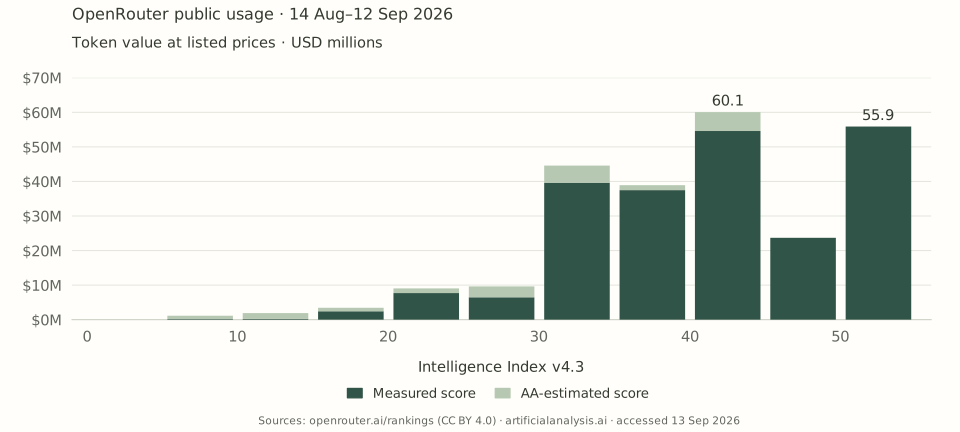
Public OpenRouter usage · 14 August–12 September 2026 · Index v4.3
Usage is bimodal: smarter vs cheaper.
The bars value public token usage at listed prices; they are not observed bills. Scores cover 87.7% of priced value, and customer motives are not measured. Among matched models, the two largest score bands are 40–45 ($60.1M) and 50–55 ($55.9M). That demand below the frontier gives labs existing business to earn from while new development slows.
[OpenRouter ↗](https://openrouter.ai/rankings)·

[Artificial Analysis ↗](https://artificialanalysis.ai/)
Calculation, coverage & data #
Scores cover 87.7% of the $283.0M priced total; $34.7M without matched scores is omitted from the graph and retained in the table and downloads. Another 6.7% of source tokens lack prices and sit outside that dollar total.
We use all 631 routes in OpenRouter’s public monthly rankings snapshot, covering 14 August through 12 September 2026. For each route, value equals prompt tokens times its listed input price, plus completion tokens times its listed output price. The September 13 catalog supplies prices. We match exact canonical model versions and retain each billing variant’s price before combining model totals. Free variants contribute $0; missing prices remain unknown.
Scores use Artificial Analysis Intelligence Index v4.3, retrieved September 13. Each exact release receives its highest measured configuration score. When only AA-estimated scores exist, we use the highest estimate and show it in light green. The scored dollar total covers 79 model releases with measured scores and 93 with estimated scores. OpenRouter does not disclose the reasoning settings of these requests: the horizontal axis describes available model capability, not the score of every request.
Bars use fixed 5-point intervals starting at zero, with the lower endpoint included and the upper endpoint excluded. Unscored models retain their known dollar value in the table and downloads; Tencent Hy4 preview accounts for $28.2M of that total. We do not substitute scores across unverified model updates, including the April and August DeepSeek V4 Pro releases or the August and September Qwen3.8 Max releases.
These are current base-price valuations of public usage, not observed bills. Actual bills also depend on caching, historical prices, provider routing, long-context tiers, negotiated discounts, and request or media fees. The public snapshot reports zero cache-detail fields throughout; it does not establish that caching was absent. The chart does not measure all OpenRouter traffic or all AI spending. Customer motives and provider margins are not measured.
As a sensitivity check, charging 80% of input tokens at the listed cache-read rate where available reduces the priced total to $100.8M. The two largest bands in this scenario are 40–45 and 50–55. This is an explicit pricing scenario, not observed billing or an uncertainty interval.
| Token value by score band | ||
|---|---|---|
| Index band | Value at list prices | Share of priced total |
| --- | --- | --- |
| 0–5 | $0.0M | 0.0% |
| 5–10 | $1.1M | 0.4% |
| 10–15 | $1.9M | 0.7% |
| 15–20 | $3.4M | 1.2% |
| 20–25 | $9.1M | 3.2% |
| 25–30 | $9.6M | 3.4% |
| 30–35 | $44.6M | 15.8% |
| 35–40 | $38.9M | 13.8% |
| 40–45 | $60.1M | 21.2% |
| 45–50 | $23.7M | 8.4% |
| 50–55 | $55.9M | 19.7% |
| Unscored | $34.7M | 12.3% |
Download the calculation and model-level data (JSON) · CSV · Graph (SVG)
Source: OpenRouter Rankings, accessed September 13, 2026; usage through September 12. Rankings data are licensed under CC BY 4.0. OpenRouter data documentation · Artificial Analysis benchmark methodology. The download preserves source URLs, retrieval times, checksums, matching decisions, and rows without prices or scores.
04
Labs that develop frontier AI are trapped between a rock and a hard place. #
Each lab has a reason to keep investing: falling behind threatens the premium needed to repay its last investment. When rivals answer each advance with another investment, the industry spends more to win advantages that last less time. The competitive cycle repeats in three stages:
- Invest to buy a lead. If larger training runs remain a reliable route to better performance, rivals push up the scale of research and compute needed to compete.
- Compete away the premium. As rivals catch up, customers gain cheaper substitutes. Prices fall; margins shrink when serving costs do not fall as quickly.
- Invest again to defend the business. A lab seeks another capability advantage to restore its premium. Its rivals respond with their own investments, starting the cycle again.
That cycle becomes a competitive death spiral when each round leaves a bigger gap between the development bill and the earnings available to pay it. What makes sense for one lab traps the industry in an increasingly expensive race. Growing demand and falling costs ease the pressure; larger development bills and shrinking margins intensify it. Regulatory intervention that interrupts the cycle protects incumbents’ earnings and reduces the spending needed to defend them.
OpenAI’s reported 2025 sales left $5.57B after the cost of sales—its gross profit—against $19.18B in research and development. That covered about 29% of the research bill, even as its gross margin rose from about 28% in 2024 to 43% in 2025. Better margins still left most of the development bill to be funded elsewhere. Delaying the next bill gives existing models more time to pay for the last one.
Explore the assumptions · Portfolio financing over three years
The financial tradeoff between racing and pacing.
The default assumptions are a $40B annualized sales run rate, a 40% starting contribution margin after serving costs, and a $10B first development budget. The three scenarios put model releases 6, 10.5 and 15 months apart, using the same economic assumptions. These are illustrative assumptions anchored to reported scale; they do not estimate the value of a specific regulatory proposal. Choose a release interval to see how postponing development changes the lab’s financing needs.
Without pacing, peak uncovered spending is $79.2B.
With these settings, the first development budget is $10.0B and each successive budget is 25% larger. 25% is paid when a round starts; the rest is paid evenly through that round. Task volume grows 50% a year; without pacing, task prices fall 30% and serving cost per task falls 20% a year.
The line subtracts cumulative customer contribution—sales left after serving costs—from development payments made so far. Above zero is the amount customers have not funded; below zero is a surplus before other expenses. Overhead, financing, taxes and cash already raised are excluded.
| 36-month baseline | |
|---|---|
| Outcome | Without pacing |
| --- | --- |
| Months between model releases | 6 |
| Peak uncovered spending | $79.2B |
| Development payments through month 36 | $112.6B |
| Customer contribution through month 36 | $33.4B |
| Balance at month 36 | $79.2B uncovered |
| Development rounds | 6 completed |
| Development payments due after month 36 | $0.0B |
| Year 3: customer contribution ÷ development payments | $7.3B ÷ $54.9B ≈ 13% |
| Contribution margin at month 36 | 10% |
Without pacing, 6 development rounds are completed. Each assumed release cycle corresponds to one portfolio research budget. Future earnings beyond month 36 are not valued.
Without pacing, the contribution margin starts at 40% and ends at 10%. Prices fall faster than serving costs, squeezing the margin on each task. Choose a longer release interval to compare its effect on development spending and financing needs.
Scale: reported OpenAI 2025 R&D and gross margin; reported August 2026 sales run rate via Bloomberg, syndicated by Yahoo Finance ↗. Future growth rates, margins, payment schedules and the effects of pacing are assumptions.
Financial evidence, scenario comparisons & calculations #
No public disclosure supports a universal “$8 of every $10 recovered” ratio. That illustrative ratio came from $40B annualized revenue × 40% assumed contribution × (6 ÷ 12) years, divided by a $10B budget. It mixed a 2026 revenue run rate with a budget rounded from 2025 R&D and an assumed cash margin. It was not observed model payback.
The interactive scenarios keep those scale assumptions editable and compare repeated portfolio research budgets. Each assumed model-release cycle funds one development budget; the three release intervals are 6, 10.5 and 15 months. The initial margin is informed by reported gross margin, not a disclosed current cash margin. Budgets include training, experiments and research; they do not represent single training runs. Payment timing is also editable: the chosen share is paid upfront and the rest evenly through each cycle. A cycle that crosses month 36 pays only the amount due by that date; the unpaid remainder is shown separately as a commitment. Fractional-month starts are charged at their exact dates.
| Release timing scenarios over 36 months | |||||
|---|---|---|---|---|---|
| Scenario | Months between releases | Development rounds | Peak uncovered spending | Balance at month 36 | Development payments due after month 36 |
| --- | --- | --- | --- | --- | --- |
| Without pacing | 6 | 6 completed | $79.2B | $79.2B uncovered | $0.0B |
| Increase time between model releases by 75% | 10.5 | 3 completed, 1 in progress | $15.9B | $15.9B uncovered | $8.4B |
| Increase time between model releases by 150% | 15 | 2 completed, 1 in progress | $2.5B | $2.3B surplus | $7.0B |
Task volume, price and serving cost compound independently. Revenue equals tasks sold times price; contribution subtracts the cost of serving those tasks. A falling price compresses the percentage margin only when unit serving cost falls more slowly. Total contribution grows when additional paid volume more than offsets the decline in contribution per task. Budget size grows with each round, not with the passage of time alone.
Slower paths fund fewer rounds and are not assumed equally capable. Price erosion avoided by pacing and foregone task volume are separate assumptions, both zero by default. The same settings apply to either paced scenario and have no effect without pacing. Serving efficiency follows calendar time in all paths; a chosen demand shortfall compounds annually relative to the race. This does not estimate how much coordination would actually preserve prices or sacrifice innovation.
Uncovered spending is development payments minus cumulative customer contribution, before overhead, interest, taxes, working capital, existing cash or outside capital. Negative serving contribution is allowed; the model omits responses such as raising prices, cutting capacity or stopping. Future model value beyond the three-year horizon is omitted. These are stress tests, not estimates of a strategic equilibrium or predictions of bankruptcy.
| Gross profit falls short of development spending | ||||
|---|---|---|---|---|
| Lab / period | Revenue | Gross profit | R&D expense | R&D covered by gross profit |
| --- | --- | --- | --- | --- |
| OpenAI 2025 | $13.07B | $5.57B | $19.18B | 29% |
| MiniMax ↗H1 2026 | $116.57M | $20.81M | $296.87M | 7% |
| Z.ai / Zhipu ↗H1 2026 | ¥953.89M | ¥251.61M | ¥2131.17M | 11.8% |
| SpaceX AI segment ↗Q2 2026 | $2.56B | $1.46B | $2.18B | 66.8% |
These are company or segment accounts across different periods and product mixes. Gross profit divided by R&D measures accounting coverage, not the cash recovered from one model. MiniMax, Z.ai and SpaceX report unaudited interim results; SpaceX’s AI segment also includes X advertising and cloud infrastructure.
Read the financial and inference analysis · Scenario assumptions (JSON) · Scenario cash-flow results (JSON)
Profitable labs have this incentive too. Anthropic announced a $47B revenue run rate in May, and reportedly expects a second consecutive quarter of positive adjusted operating income, although Reuters did not independently verify that report. A healthy balance sheet does not erase the benefit of prolonging a premium or avoiding defensive spending. Profitability changes the value of waiting; it does not remove the incentive to seek favorable rules. Anthropic ↗
05
Frontier labs will tell you that they want to slow down progress; they won't tell you that they financially need to slow down progress. #
Amodei’s safety case is that slower development buys time to test models, improve safeguards and investigate dangerous behavior. His plan ties that work to government-backed limits on competitors’ progress. Those limits also protect the labs’ commercial position; their financial value does not depend on the safety case being correct.
One AI Futures example for reducing existential risk sets minimum compute allocations of 70% for serving customers and 25% for transparent safety research, leaving at most 5% for capabilities research and development. The safety requirement consumes resources, but the package also keeps existing models earning while sharply limiting work on their replacements.
Without the government stepping in to enforce a slowdown, labs cannot economically slow down on their own, and they also cannot afford not to. A lab which slows down loses the ability to command the premium that would be necessary to pay for frontier model training. A lab which doesn't slow down still finds the upfront costs of training eating into its margins even as fast-follow competitors from China and elsewhere close the gap on performance, reducing the premium that customers are willing to pay.
Frontier labs have a massive financial incentive to pace the frontier. Unless they do so, both leading companies find themselves in a “damned if you do, damned if you don't” situation. They cannot afford to be in second place, and they have to spend as fast as they can just to stay in first. Many people inside these labs sincerely believe AI poses an existential threat to humanity, but we would be remiss not to recognize that these labs and those aforementioned people, to an absurd degree, stand to benefit financially from pacing the frontier.