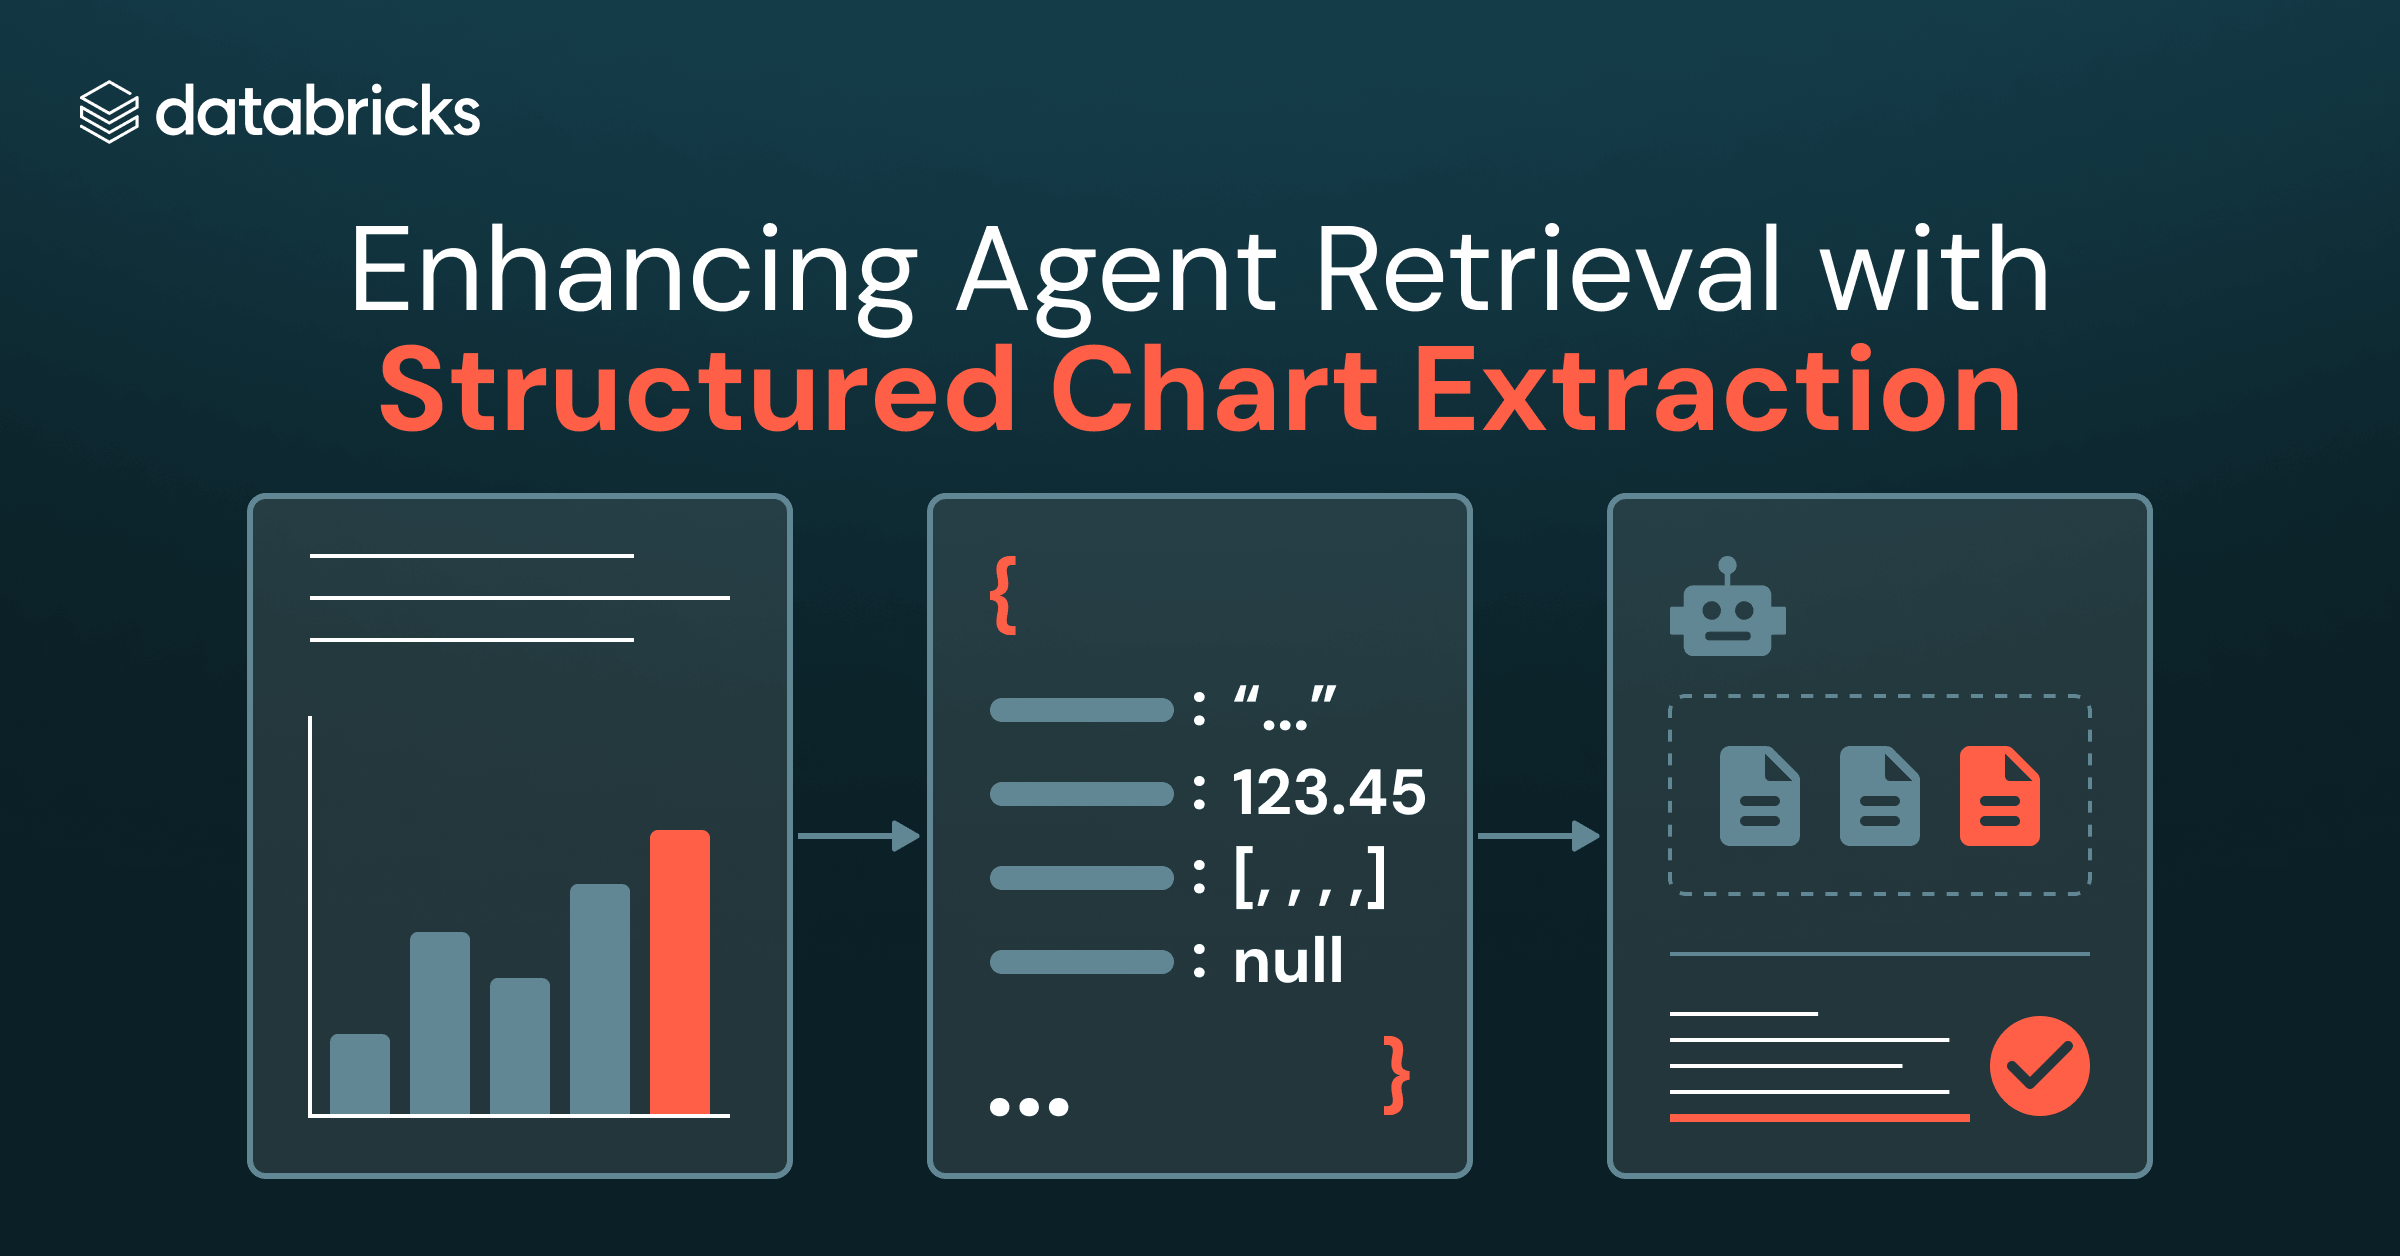
Structured chart extraction in ai_parse_document, paired with lightweight text retrieval, improves chart retrieval and agent answer accuracy while outperforming large multimodal embedding models.
More and more enterprises are now asking agents to work with their proprietary documents and answer questions about their contents. However, much of the important information lives inside figures and charts. Many customers have been finding that agents struggle to answer questions that require reading and counting values in charts. For agents to work reliably in diverse enterprise settings, we need to make charts more interpretable.
How can we make a chart easier for agents to understand? We ran a simple, quick test: we asked different agents, “How many local maxima are on this chart?”
Below is a comparison of a frontier agent and Databricks Genie at answering this question. The frontier agent was passed just the image, spent 50 seconds reasoning, but still got an incorrect answer of 17. Meanwhile, Databricks Genie used a structured extraction of the chart through ai_parse_document, and got the correct answer 18.
| Response from a frontier agent with just the image (incorrect): | Response from Genie Agent with a structured extraction of the chart (correct): |
We noticed these shortcomings in our OfficeQA Pro benchmark, where models performed worse on chart-based and multimodal questions than on questions that did not require chart understanding. We see the same gaps in customers’ information retrieval systems, particularly in financial services. A text-based retrieval system can only search the text space. A common solution is to generate a caption to describe what a chart is about; however, that may miss the data needed for fine-grained questions on the numbers inside the chart. As a result, the system may retrieve the wrong page, or retrieve the right page without having enough information to answer the question.
In this post, we show that structured extraction from charts improves both retrieval and answer quality on chart-based questions. We evaluate our approach on two datasets: a chart-heavy subset of ViDoRe V3, a benchmark for retrieval and question answering over visually rich documents, and a synthetic chart-focused dataset we call Chart-RAG. Our approach performs competitively with large single-vector and multi-vector multimodal embedding models.
We build a chart-aware retrieval pipeline end-to-end with Databricks’s AI functions, a set of composable functions that are optimized with state-of-the-art research techniques (see Figure 2). We used ai_parse_document to extract document content, including charts represented as structured JSON, and ai_prep_search to transform the content into retrieval-ready chunks, indexed with a lightweight 300M-parameter text embedding model. We created an index from the chunks using ai_search and connected the index to Genie for retrieval and answering.
We compared two indexes, created using a 300-million parameter BGE text embedding model, built from the same source PDFs, differing only in chart figure representation:
An example chart extraction:
We evaluated 310 chart and infographic-heavy questions from the **ViDoRe V3 benchmark. **The benchmark evaluates retrieval and answering across seven domains: employment, energy, pharmaceuticals, physics, finance, computer science, and industrial documents. For each experiment, we parsed and chunked the entire 16K-page English corpus and generated answers to every query, searching over the full index.
Although chart-focused questions were selected, many could still be answered using the surrounding text. To isolate the impact of the chart content, we created a second benchmark that focused only on chart-based questions created from three complex, chart-heavy reports (BIS Quarterly Review*, IMF World Economic Outlook, *J.P. Morgan Long-Term Capital Market Assumptions). We wrote 114 visually grounded questions from these 3 documents totaling 378 pages to build the synthetic Chart-RAG dataset.
Grading: We scored each answer as Correct / Partially Correct / Incorrect using an LLM judge (gemini-3-flash) against its gold answer.
Retrieval: We report Hit Rate@10 and nDCG@10. Hit Rate@10 checks whether at least one gold page appears in the top 10 retrieved results. The questions from the ViDoRe benchmark may have multiple gold pages, each with a relevance score of 1 or 2. For Hit Rate@10, we convert graded relevance to binary relevance by allowing pages with either score to count as a hit. For nDCG@10, we keep the original graded relevance. In the Chart-RAG dataset, each query has one gold page.
To achieve stable measurement, we ran each configuration three times and report the results with confidence intervals.
Structured Chart JSON improves both answer quality and retrieval across both datasets. The question-level analysis below shows when corrected answers coincide with better retrieval.
The following example from the **Chart-RAG **dataset demonstrates how JSON representations improve retrieval and answer quality:
| Question | Answer Before | Answer with chart-JSON enriched ai_parse_document |
|---|---|---|
| Roughly what peak level (% pts) did the Oil VIX reach toward Q1 2026? | ||
| "I cannot find specific information about the exact peak level of the Oil VIX in Q1 2026 in the provided search results...." | "According to the data presented, the Oil VIX reached approximately 80 percentage points in Q1 2026." |
This retrieval gain may not be limited to questions about a chart. Extracted chart values and labels can make the page itself easier to retrieve, even when the answer doesn’t appear directly on the chart.
Some questions depend on how a figure looks instead of just its values. To measure the benefit of restoring visual context, we gave the agent images corresponding to the top three retrieved text chunks with the JSON at answer time.
Here, retrieval is unchanged. Images add 4 percentage points on the Chart-RAG dataset, and 2.6 percentage points on the ViDoRe V3 subset.
One question is how our approach, which uses a lightweight 300-million-parameter text embedding model, compares with multimodal embedding models. We benchmarked against four alternatives: ColQwen2.5-3B, a large multi-vector multimodal embedding model that uses late-interaction scoring, Qwen3-VL-Embedding-2B, a large single-vector multimodal embedding model, and the lighter single-vector models Jina CLIP v2 (0.9B parameters) and CLIP ViT-L/14 (428M parameters). Each multimodal model embedded every page. At query time, we ranked pages using MaxSim for ColQwen2.5-3B and cosine similarity for the single-vector models, searched against the entire corpus, and passed the five highest-scoring pages to the answering VLM. We report answer correctness using five retrieved pages for two reasons. First, it provides a balanced midpoint between the best-performing depths for the ViDoRe subset and Chart-RAG datasets. Second, five pages approximate the average input context used in our approach, enabling a fair comparison. We still report nDCG@10 as the standard retrieval metric.
For the strongest models, retrieval on the Chart-RAG dataset is close to saturated due to the small corpus size of 378 pages. The more interesting comparison here, therefore, is answer quality. On ViDoRe V3, chart-JSON with the top three images reaches 75.9% correctness. On Chart-RAG, the same setup reaches 75.1%. Both cases exceed the four multimodal embedding baselines while passing only three images to the model. This performance comes from a roughly 10x smaller and simpler alternative to ColQwen2.5-3B’s multi-vector, late-interaction architecture. Structured chart preprocessing can therefore provide competitive answer quality with a smaller image budget and lower indexing and retrieval overhead.
Charts are a dominant form of information in enterprise documents. Making chart information easy to find and clearly interpretable is critical for retrieval agents’ accuracy. Structured chart JSON bridges the gap in the classic RAG system by adding precise values to the retrieval index and for agents to reason with. We show that structured chart JSON improves both retrieval quality and agent answer accuracy. Future work could further explore how different structured extraction representation formats impact the retrieval and answer accuracy.
The chart-JSON enrichment for ai_parse_document will be available soon, so any document parsed will automatically include its chart values as structured text, without any changes to the function’s interface. For retrieval, we recommend pairing it with ai_prep_search. This capability will also power Genie One to improve answers to chart-related questions over PDFs for databricks customers.
Authors: Amrutha Srivatsav, Ivan Zhou, Jasmine Collins, Michael Bendersky, Adyasha Maharana, Erich Elsen, Xing Chen, Matei Zaharia
Subscribe to our blog and get the latest posts delivered to your inbox.