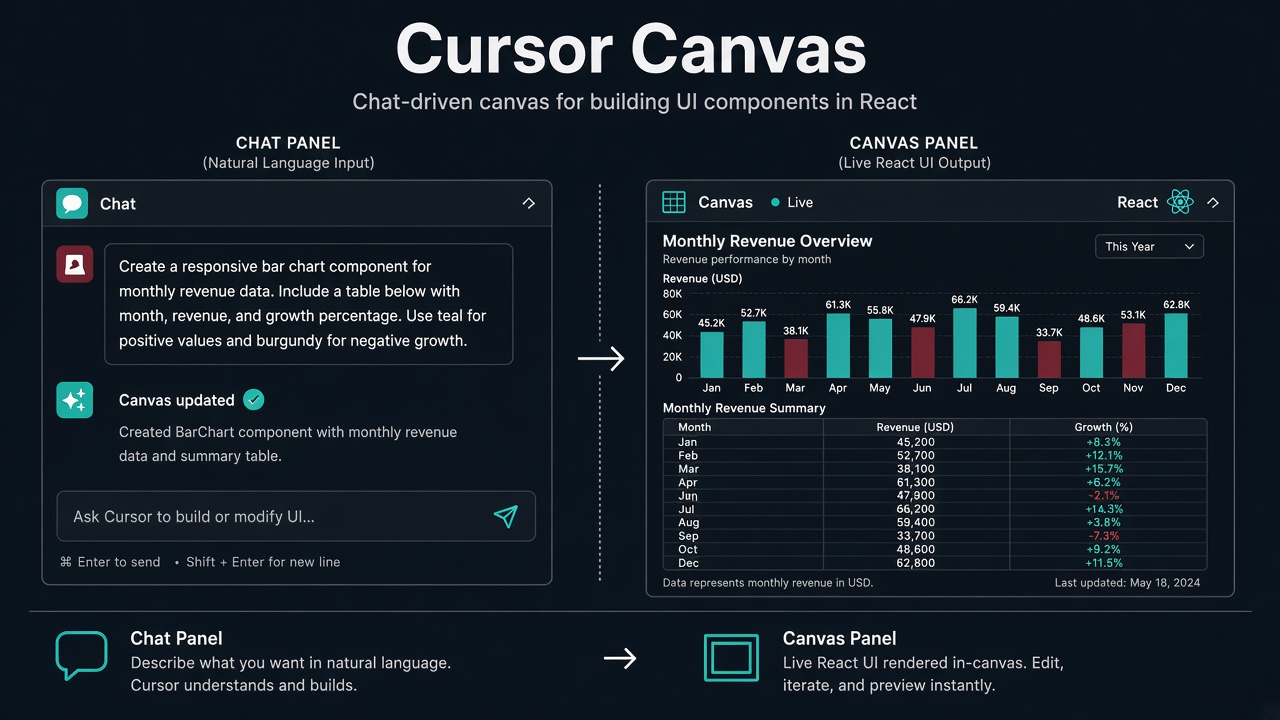
Cursor Canvas (shipped in Cursor 3.1) lets the agent create interactive artifacts that render next to the chat — dashboards, analyses, audits, and reports with sections, stats, and tables you can reopen and iterate on. Official product docs: cursor.com/docs/agent/tools/canvas. This post combines that product guide with the authoring conventions agents follow when building .canvas.tsx files with the cursor/canvas component library.
%%{init: {"theme": "base", "themeVariables": {"background": "transparent", "lineColor": "#000000"}}}%%
graph LR
    A[User question] --> B[Agent reasoning]
    B --> C{Standalone artifact?}
    C -->|Yes| D[".canvas.tsx file"]
    C -->|No| E[Chat reply / code edit]
    D --> F[IDE compiles React]
    F --> G[Panel beside chat]
    G --> H[Charts · Tables · Tabs]

    classDef agent fill:#8B0000,color:#fff
    classDef hook fill:#189AB4,color:#fff
    classDef decision fill:#444,color:#fff

    class B agent
    class D hook
    class C decision
What is Cursor Canvas? #
Per Cursor’s docs: canvases are standalone views you can reopen, edit, and iterate on — instead of scrolling through a long markdown table or code block. Under the hood, agents author a single .canvas.tsx React file using first-party components (tables, boxes, diagrams, charts). Unlike a chat reply, the canvas persists in your workspace canvas list.
How it works (official flow) #
- Cursor decides your task benefits from a visual or interactive view — or you ask for one directly.
- Cursor builds the canvas and inserts a reference in your chat.
- You review the rendered view, switch to source to tweak it, or ask Cursor to change it.
- Cursor saves the canvas so you can reopen and rerun it later with fresh data.
Each canvas appears in your workspace’s canvas list, so you can jump back without rerunning the agent.
Opening a canvas #
- From chat — when Cursor creates a canvas, a card appears at the end of the response. Click it to open.
- Command Palette — runOpen Canvas , listed under View.
- Agents Window — open a canvas tab from the new-tab menu. Canvases live alongside terminal, browser, and source control.
Sharing canvases with your team #
Use Publish from the canvas toolbar to publish or refresh a share, then copy the link. Teammates get a read-only browser snapshot — same layout, charts, and tables — without rerunning the agent.
| Rule | Detail |
|---|---|
| Plans | Pro, Teams, and Enterprise — free accounts cannot create shares |
| Team membership | Only team members can open a share link |
| Privacy mode | Requires a mode that allows data storage — Legacy Privacy Mode blocks sharing |
| Dashboard | Shared Canvases page lists your own publishes only — ask teammates for their link |
| Admin control | Team admins can disable shared canvases in team settings |
Iterating on a canvas #
- Layout wrong? Tell Cursor what to change — usually faster than hand-editing.
- Numbers stale? Ask Cursor to rerun the underlying query or show its work.
- Large rework? Revert and re-prompt with more detail.
- Small tweak? Manually edit the source code.
Authoring conventions (agent skill + SDK) #
- One file only — no helpers, no CSS modules, no npm installs
- Import from
cursor/canvas— layout, charts, tables, forms, diffs (React hooks likeuseStateare re-exported here too) - Inline data in the canvas — the canvas runtime must not call
fetch(); the agent runs SQL, API, MCP, or shell queries and embeds results when building the file - Theme-aware — colours from
useHostTheme(), not hard-coded hex - Persistent UI state —
useCanvasStatestores values in a.canvas.data.jsonsidecar beside the canvas file
A canvas exists when the deliverable is the analysis itself — not a code fix, not a drafted email, not a dashboard in another product.
When to use a canvas — and when not to #
The trigger is user intent, not response length. A long markdown table is still the wrong medium if the user asked for a PR fix.
| Use canvas | Skip canvas |
|---|---|
| Billing or usage investigations with structured findings | “Fix this bug” or “draft a support reply” |
| Security audits with categorised findings | Work inside an existing HTML dashboard or repo file |
| Cross-system overlap reports (MCP query results) | MCP queried only as a step toward a different deliverable |
| Architecture proposals with comparison tables | User asked for a Datadog dashboard specifically |
| Margin decompositions, CTR reports, trend charts | Short factual answers or one-line clarifications |
Real examples from production workflows
- Lyric video visual plan — tabbed canvas with measured gap tables for a Tamil worship song (37s intro, 34s post-bridge vamp).
- Graphics proposal — Remotion vs Three.js comparison with phased build order.
- YouTube CTR report — thumbnail performance with
BarChartandStattiles.
Where canvas files live #
Canvases live in Cursor’s managed project folder — not in your git repo by default. Subfolders and alternate extensions are not detected:
~/.cursor/projects/<workspace>/canvases/<name>.canvas.tsx
- Use kebab-case filenames ending in
.canvas.tsx - Default-export the top-level React component
- Do not create the directory manually — Cursor provisions it
- Every edit returns a Canvas TypeScript check line in tool output
- Link the full absolute path when mentioning a canvas in chat
The cursor/canvas SDK — full export surface #
Import everything from one package. The public API is declared in ~/.cursor/skills-cursor/canvas/sdk/index.d.ts — read it before guessing prop names; referencing a non-existent export is the most common runtime error.
| Category | Exports | Typical use |
|---|---|---|
| Layout | Stack ,Row ,Grid ,Spacer ,Divider |
Page structure without raw div soup |
| Typography | H1 ,H2 ,H3 ,Text ,Link ,Code |
Hierarchy and inline code |
| Surfaces | Card ,CardHeader ,CardBody ,Callout |
Grouped content — mix open sections with cards |
| Data | Table ,Stat ,UsageBar ,Swatch |
Benchmarks, status rows, segmented meters |
| Charts | BarChart ,LineChart ,PieChart |
Inline SVG — zero external deps |
| Diffs | DiffView ,DiffStats |
File-level change summaries |
| Forms | TextInput ,Select ,Toggle ,Checkbox ,Pill ,Button |
Filters and tab switches |
| Hooks | useHostTheme ,useCanvasState ,useCanvasAction |
Theme tokens and persisted UI state |
| Advanced | CollapsibleSection ,TodoList ,computeDAGLayout |
Disclosures, checklists, DAG layouts |
Layout and typography primitives #
Stack vertical spacing and Row horizontal alignment replace most flexbox boilerplate. Grid handles responsive columns. Keep primary content wider — a common pattern is maxWidth: 1080 on the outer stack with padding: 24.
import { Stack, Row, H1, Text, Stat, useHostTheme } from "cursor/canvas";

export default function Overview() {
  const theme = useHostTheme();
  return (
    <Stack gap={24} style={{ padding: 24, maxWidth: 1080 }}>
      <H1>API latency review</H1>
      <Text tone="secondary">Source: Datadog · last 7 days</Text>
      <Row gap={16} wrap>
        <Stat value="142 ms" label="p95 latency" tone="warning" />
        <Stat value="99.96%" label="uptime" tone="success" />
      </Row>
    </Stack>
  );
}
Stat tiles give skimmers the headline numbers; Table carries the evidence rows underneath.
Charts — BarChart, LineChart, PieChart #
Canvas charts are pure inline SVG via the cursor/canvas SDK — no Highcharts, no Chart.js, no runtime network calls. Every chart needs a title in surrounding prose, axis labels with units, a legend when multiple series appear, and a source/time-range caption.
BarChart capabilities
| Prop | Type / default | Effect |
|---|---|---|
categories |
string[] | Independent axis labels |
series |
ChartSeries[] |
Named arrays aligned by index |
stacked |
boolean | Stack series vertically |
normalized |
boolean | 100% stacked share mode |
horizontal |
boolean | Horizontal bars instead of columns |
referenceLines |
{ value, label?, tone? }[] |
SLO / budget / mean markers |
valueSuffix |
string | e.g. " ms" or"%" |
beginAtZero |
true | Set false to zoom tight ranges (uptime 99.0–99.9%) |
import { BarChart } from "cursor/canvas";

<BarChart
  categories={["Mon", "Tue", "Wed", "Thu", "Fri"]}
  series={[
    { name: "Accepted", data: [70, 80, 60, 90, 85], tone: "success" },
    { name: "Rejected", data: [30, 20, 40, 10, 15], tone: "danger" },
  ]}
  stacked
  valueSuffix="%"
  referenceLines={[{ value: 50, label: "Target", tone: "warning" }]}
  height={240}
/>
LineChart and PieChart
- LineChart — multi-series polylines; set
fillfor area shading; hover shows vertical guide + tooltip; pass date strings as pre-formattedcategories(not a time-series parser). - PieChart — flat
{ label, value, tone? }[]array; setdonutfor hollow centre with summed total; hover expands slice and dims others. - Semantic tones —
success,danger,warning,info,neutralmatchStat,Pill, andTablerow tones on the same page.
%%{init: {"theme": "base", "themeVariables": {"background": "transparent", "lineColor": "#000000"}}}%%
pie title Canvas chart picker
    "Compare categories" : 45
    "Trend over periods" : 30
    "Part-of-whole share" : 25
Interactive tabs with useCanvasState #
Multi-section canvases use Pill buttons plus useCanvasState so tab selection persists across rebuilds, reloads, and IDE restarts — stored in a .canvas.data.json sidecar next to the canvas file. Pattern: define a union type for tab ids, map pills, conditionally render section components.
import { Pill, Row, Stack, useCanvasState } from "cursor/canvas";

type Tab = "overview" | "charts" | "raw";

const TABS: { id: Tab; label: string }[] = [
  { id: "overview", label: "Overview" },
  { id: "charts", label: "Charts" },
  { id: "raw", label: "Raw data" },
];

export default function Report() {
  const [tab, setTab] = useCanvasState<Tab>("tab", "overview");
  return (
    <Stack gap={20}>
      <Row gap={8} wrap>
        {TABS.map((t) => (
          <Pill key={t.id} active={tab === t.id} onClick={() => setTab(t.id)}>
            {t.label}
          </Pill>
        ))}
      </Row>
      {tab === "overview" ? <Overview /> : null}
      {tab === "charts" ? <Charts /> : null}
      {tab === "raw" ? <RawTable /> : null}
    </Stack>
  );
}
Tables, Callouts, and diff surfaces #
Table accepts headers, rows, optional rowTone per row, and striped. Use it for benchmark matrices, gap inventories, and API field catalogues. Callout carries a one-line verdict with tone (success, warning, danger, info).
| Component | Key props | When |
|---|---|---|
Table |
headers, rows, rowTone[], striped | Every row from source data — do not summarise away numbers |
Callout |
title, tone, children | Section verdict before detail |
DiffView |
lines with type add/remove/context | Code review findings inside CardBody |
UsageBar |
segments with label + value | Quota / budget consumption |
CollapsibleSection |
header + children | Long appendix without wall-of-text |
Theme tokens — useHostTheme() #
All colours must come from useHostTheme() tokens — no hard-coded hex, no gradients, no box-shadows. The hook returns palette entries for text, surfaces, strokes, and accents that adapt to light/dark IDE themes.
- Use accent colour sparingly — one primary insight per viewport
- Most elements stay neutral; colour carries semantic meaning
mergeStyleshallow-merges token styles with overrides- Run the skill’s pre-delivery slop check before returning canvas code
Design anti-patterns — the slop checklist #
If two or more of these appear, redesign before shipping:
| Forbidden pattern | Why it fails | Fix |
|---|---|---|
| Gradients / background-clip text | Reads as AI slop, fights IDE theme | Flat surfaces from tokens |
| Emojis as icons or bullets | Breaks professional tone | Text labels or Pill tones |
| Box shadows everywhere | Violates flat canvas spec | Structural borders only |
| Wall of identical cards | No visual hierarchy | Mix open Stack sections with cards |
| Rainbow colouring | Nothing reads as primary | One accent, rest neutral |
| Empty chart frames / “No data” | Canvas must show real content | Omit the section entirely |
| Placeholder text (“TODO”, “Example”) | Canvas is the deliverable | Ask user for missing data instead |
Squint test: blur your eyes — can you tell what matters in under two seconds?
Packaging canvas workflows in skills #
Cursor docs recommend packaging repeat canvas workflows as skills so every prompt produces the same layout shape:
- Trigger description — e.g. “quarterly revenue report” or “dependency audit”
- Layout instructions — sections, stats, and tables the canvas should contain
- Data sources — SQL query, API call, MCP tool, or shell command the agent runs before embedding results
- Formatting rules — units, date ranges, sort order
Once the skill is in place, a short prompt regenerates the canvas with fresh data — every teammate using the skill gets the same output shape.
Charts on mer.vin — Mermaid when you are not in the IDE #
Blog posts on mer.vin cannot run cursor/canvas React — but they can carry the same information density with Gutenberg blocks. Use wp:merpress/mermaidjs for diagrams and chart-like visuals. Never use [mermaid]…[/mermaid] shortcodes.
Mermaid pie chart (part-of-whole)
%%{init: {"theme": "base", "themeVariables": {"background": "transparent", "lineColor": "#000000"}}}%%
pie title Agent output routing (typical week)
    "Chat prose only" : 55
    "Code edits" : 30
    "Canvas artifacts" : 15
Mermaid bar chart (xychart-beta)
%%{init: {"theme": "base", "themeVariables": {"background": "transparent", "lineColor": "#000000"}}}%%
xychart-beta
    title "Canvas SDK component usage (example audit)"
    x-axis [Layout, Charts, Tables, Forms, Diffs]
    y-axis "Files using component" 0 --> 12
    bar [9, 6, 8, 4, 2]
Pair Mermaid charts with wp:table for exact numbers — charts give the shape; tables hold the evidence rows readers will cite.
Gutenberg blocks available on mer.vin #
This post itself uses the full mer.vin block set. Pick blocks per section based on what helps the reader digest that part — no fixed recipe.
| Block | Gutenberg marker | Best for |
|---|---|---|
| Paragraph | wp:paragraph |
Glue prose; <mark> for key terms |
| Heading | wp:heading |
H2 sections; H3 sub-topics |
| List | wp:list |
Steps, takeaways (bullet or ordered) |
| Quote | wp:quote |
One-sentence section summary |
| Table | wp:table |
Specs, benchmarks, comparisons |
| Code | wp:code |
Copy-paste-ready examples |
| Mermaid | wp:merpress/mermaidjs |
Architecture, flow, charts |
| Image | wp:image |
Uploaded explainers only — never hotlink |
| Video | wp:video |
Screen recordings after import |
| Separator | wp:separator |
Visual break between major parts |
Do not use wp:html, wp:columns, or wp:details on mer.vin News posts unless the brief explicitly asks.
Complete minimal canvas — copy and adapt #
import {
  BarChart,
  Callout,
  H1,
  H2,
  PieChart,
  Stack,
  Stat,
  Table,
  Text,
} from "cursor/canvas";

export default function MinimalCanvas() {
  return (
    <Stack gap={24} style={{ padding: 24, maxWidth: 960 }}>
      <H1>Release health</H1>
      <Text tone="secondary">Source: CI logs · last 5 deploys</Text>

      <Callout tone="success" title="All gates green">
        p95 latency under budget on every deploy this week.
      </Callout>

      <Stack gap={8}>
        <Stat value="118 ms" label="p95 latency" tone="success" />
        <Stat value="0" label="failed smoke tests" />
      </Stack>

      <H2>Latency by deploy</H2>
      <BarChart
        categories={["D-1", "D-2", "D-3", "D-4", "D-5"]}
        series={[{ name: "p95 (ms)", data: [142, 130, 118, 125, 118] }]}
        valueSuffix=" ms"
        referenceLines={[{ value: 150, label: "Budget", tone: "warning" }]}
      />

      <H2>Failure share</H2>
      <PieChart
        donut
        data={[
          { label: "Passing", value: 47, tone: "success" },
          { label: "Flaky", value: 3, tone: "warning" },
        ]}
      />

      <H2>Checklist</H2>
      <Table
        striped
        headers={["Gate", "Status", "Notes"]}
        rows={[
          ["Unit tests", "Pass", "946 passed"],
          ["Lint", "Pass", "0 errors"],
          ["Render smoke", "Pass", "52s clip OK"],
        ]}
        rowTone={["success", "success", "success"]}
      />
    </Stack>
  );
}
Canvas vs chat vs mer.vin — pick the right surface #
| Surface | Persistence | Charts | Interactivity | Audience |
|---|---|---|---|---|
| Chat markdown | Scrolls away | ASCII only | None | You, in-session |
| Cursor Canvas | Managed project folder + canvas list; optional team share link | Bar / Line / Pie SVG | Tabs, hover, forms, Publish share | You + team (read-only link) |
| mer.vin post | Published URL | Mermaid pie / xychart | Scroll + Mermaid render | Public readers |
| Repo markdown doc | Git history | Mermaid in preview | None in raw MD | Contributors |
Troubleshooting blank canvases #
- Confirm the file path is exactly
…/canvases/*.canvas.tsx— not a subfolder. - Check the tool result for Canvas TypeScript check errors.
- Verify every import comes from
cursor/canvasonly — no npm packages. - Ensure the component is a default export .
- Remove empty sections — a canvas with no real data should not exist.
Summary — Cursor Canvas at a glance #
| Item | Value |
|---|---|
| File format | Single .canvas.tsx default export |
| Import source | cursor/canvas only |
| Chart components | BarChart ,LineChart ,PieChart |
| State hook | useCanvasState →.canvas.data.json sidecar |
| Theme hook | useHostTheme() — no hard-coded colours |
| Network in canvas | No fetch() at runtime — agent embeds query results inline |
| Sharing | Publish toolbar → team read-only link (Pro/Teams/Enterprise) |
| Official docs | cursor.com/docs/agent/tools/canvas |
| mer.vin charts | Mermaid pie +xychart-beta via merpress block |
| Skill reference | ~/.cursor/skills-cursor/canvas/SKILL.md |
| SDK types | ~/.cursor/skills-cursor/canvas/sdk/index.d.ts |
When the analysis is the deliverable, put it in a canvas. When the lesson is the deliverable, publish it on mer.vin with tables, Mermaid, and code blocks readers can keep.