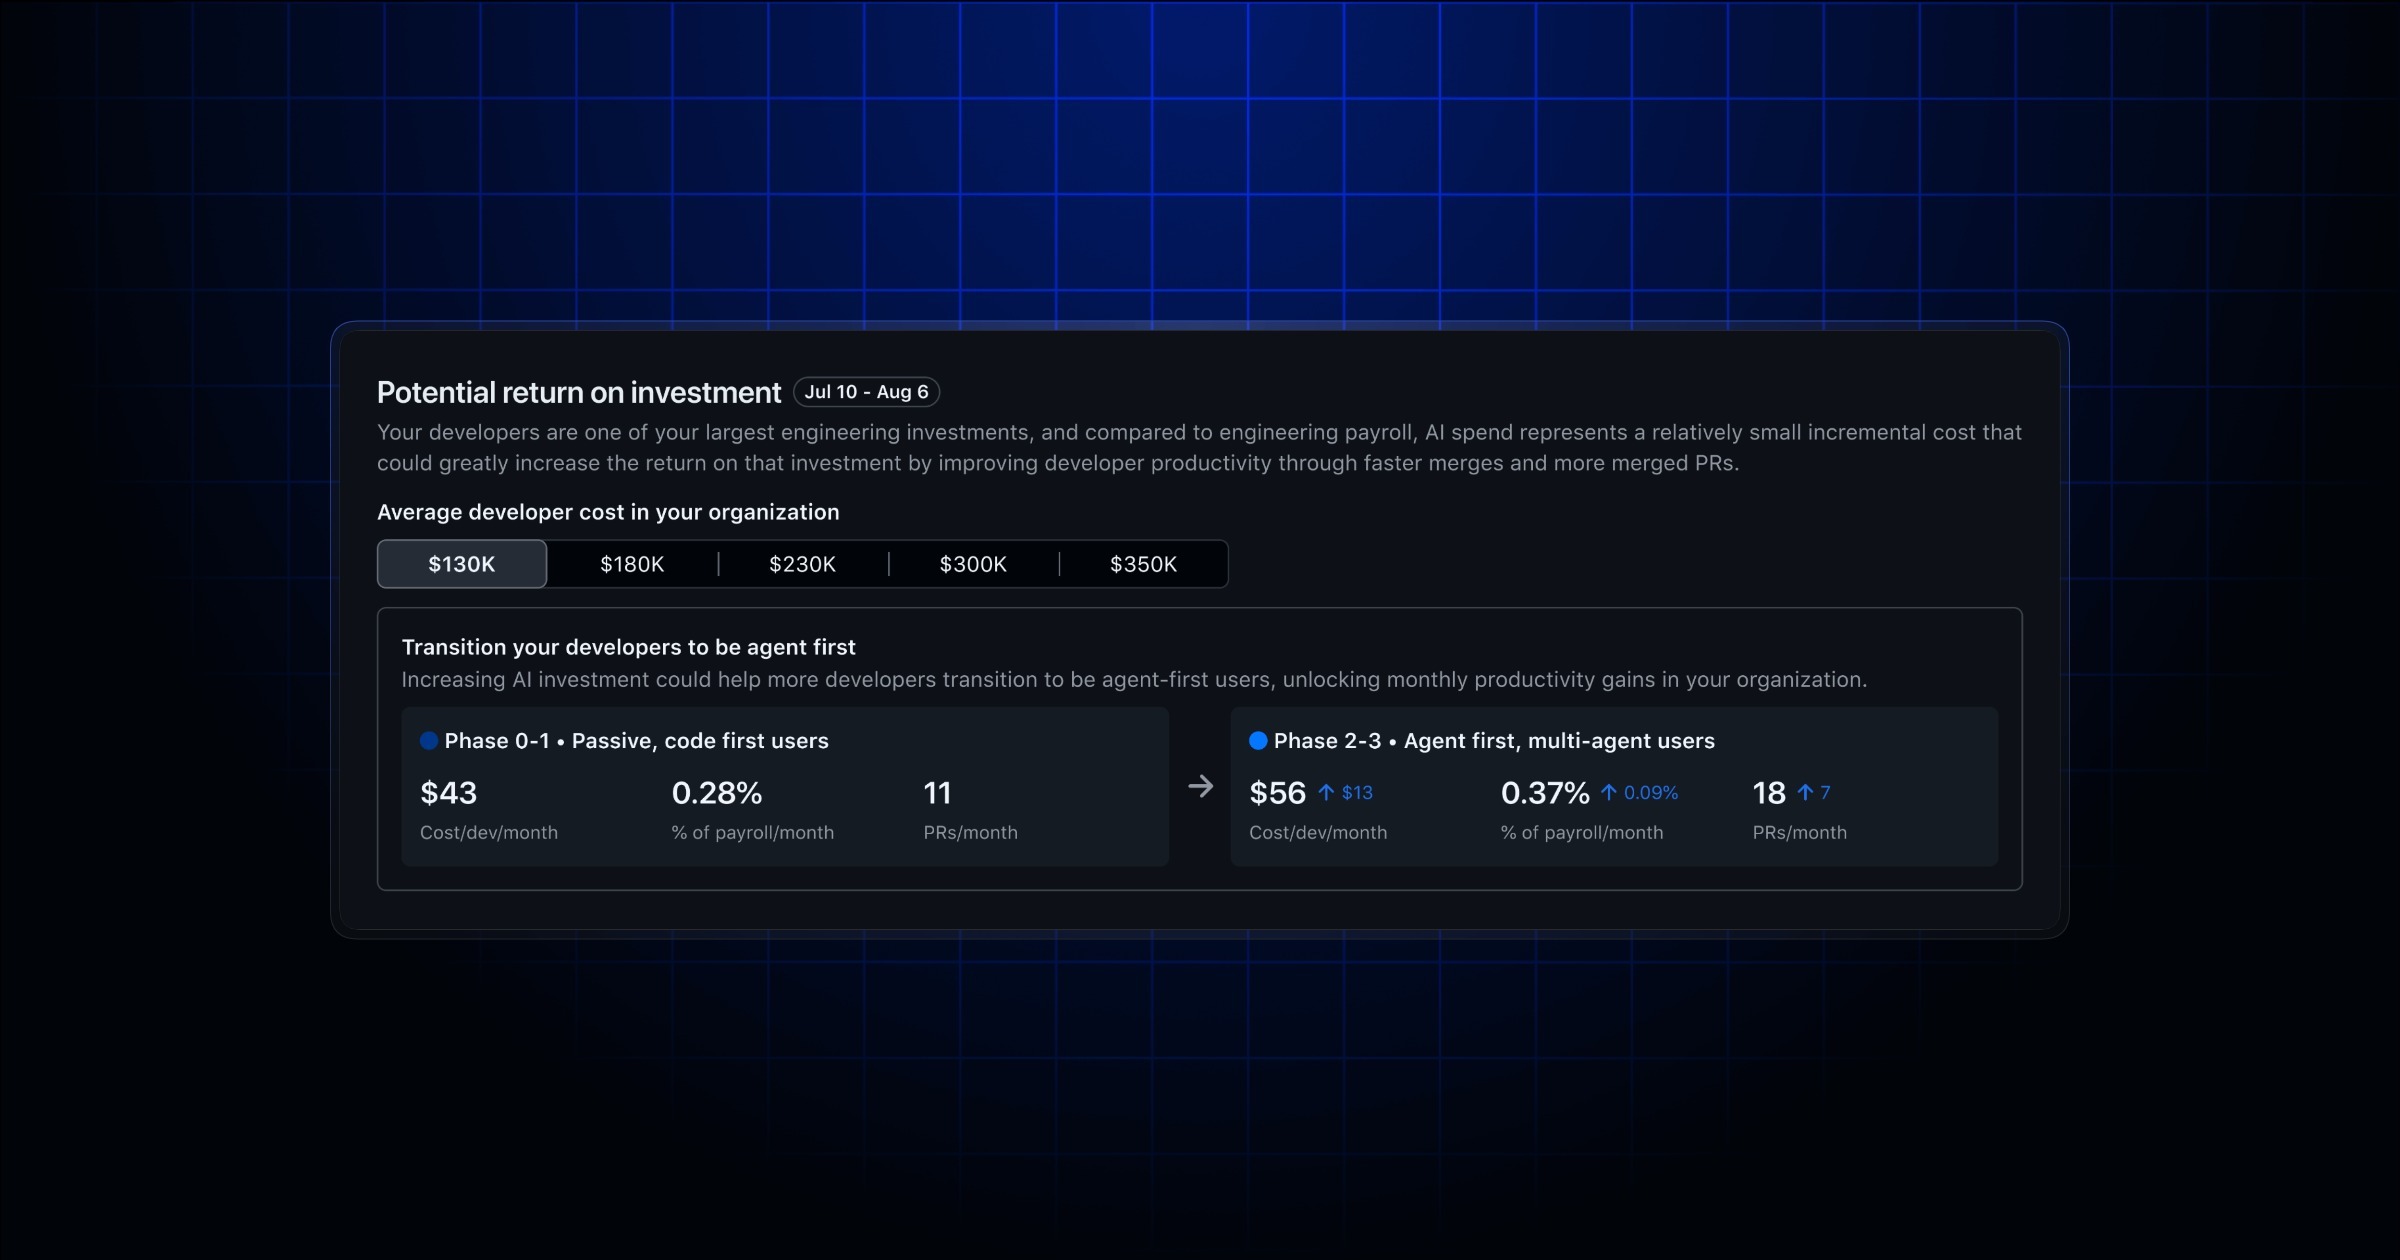
The Copilot impact dashboard now includes a “Potential return on investment” section that connects what you spend on Copilot to the pull request output you get back.
What’s new Two cards compare developers by how deeply they have adopted Copilot: those working primarily in chat and code completions (i.e., “Passive users” and “Phase 1”) against agent-first developers (i.e., “Phase 2” and “Phase 3”). Each card shows:
Cost/dev/month: The average monthly Copilot cost per developer in that group, derived from actual AI credit consumption.% Payroll/month: The above cost expressed as a share of developer compensation.** Pull requests/month**: Average pull requests per developer per month.
A salary selector lets you pick a compensation band, and the cost-derived metrics recalculate instantly. This lets you model a potential return on investment against your own payroll assumptions.
Why this matters Administrators could already see that Copilot adoption was deepening, but not what that deeper adoption costs or what it returns. This section puts spend and output side by side for early-phase and agent-first developers, so you can justify continued investment and target enablement programs at the adoption phases with the most headroom left.
Also in this release More accurate adoption cohort user counts. Cohort user counts now reflect every user active during the full 28-day reporting window, rather than only users active on the window’s final day. Previously, a report ending on a weekend or holiday could show sharply lower counts in each phase. Expect cohort counts to be noticeably higher going forward. This only affects the impact dashboard — the Copilot usage metrics API and NDJSON exports are unchanged.
- The return on investment section is available in the Copilot impact dashboard at both the enterprise and organization level.
- It is available to enterprise owners and billing managers, organization owners, and anyone with a custom organization or enterprise role that grants the
View Copilot Metrics
permission. The Copilot usage metrics policy must be enabled. - Cost figures are estimates based on AI credit consumption, and the salary selector is a modeling input rather than actual payroll data. Treat these metrics as directional.
Visit the Copilot impact dashboard documentation to get started.