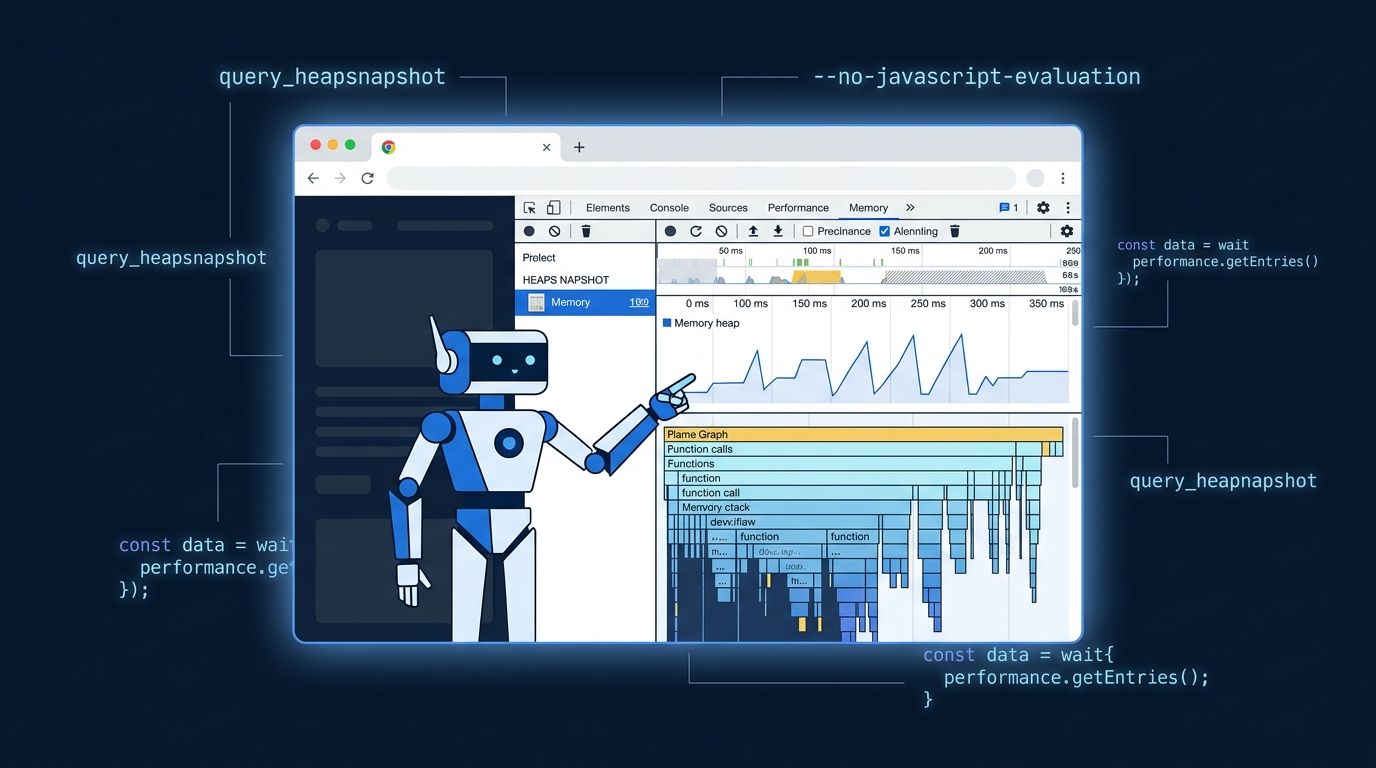
Your AI coding agent can write the code. It can run the tests. But until recently, the browser was still your job — you were the one opening DevTools, hunting memory leaks, and interpreting flame charts while the agent waited. That dynamic is shifting. Chrome DevTools MCP server 1.9 ships with capabilities that let your agent do the browser debugging work too, and the October 2026 DevTools update rounds it out with SPA performance measurement that was technically impossible before.
What Just Shipped #
Two releases landed this fall. Version 1.8 (August 25) introduced query_heapsnapshot — a structured way for agents to interrogate heap snapshots by retained size or property name instead of parsing raw JSON. Version 1.9 (September 8) added the more consequential piece: the ability to disable JavaScript execution entirely during an agent-driven inspection session.
The October 2026 DevTools update then layered in full soft navigation support for SPAs and CPU performance tier overrides — rounding out a suite of capabilities that makes agent-assisted browser debugging genuinely practical.
Heap Memory Debugging Without the Manual Hunt #
Memory leak hunting is one of the most tedious debugging tasks. Open a heap snapshot, sort by retained size, scroll through thousands of rows, cross-reference with your code. It requires pattern recognition that’s hard to automate because the data is unstructured.
query_heapsnapshot changes that. Your agent can now call:
query_heapsnapshot(retained_size_threshold: 50000)
…and get back a structured list of the top memory offenders, with self size, retained size, and V8 execution context retention broken out. It can query by property name too — useful when you suspect a specific object type is leaking. The agent spots the problem, explains it, and proposes a fix. You don’t need to be the one staring at the flame chart.
Safe Production Inspection #
The --no-javascript-evaluation flag is the feature that will matter most to teams debugging production. Before it, connecting an agent to a live page meant risk — a tool call could accidentally trigger an analytics event, fire a form submission, or mutate state in ways that were impossible to fully anticipate. That made agents a liability in production sessions.
With v1.9, you can start the MCP server with JavaScript evaluation disabled. The agent can still inspect the DOM, read styles, analyze network traffic, and query the accessibility tree — it just cannot evaluate scripts. The restriction persists across navigations and initialization scripts, so there’s no way for an agent to accidentally slip into an unsafe mode mid-session.
This is the safety rail that production debugging needed. Teams that were keeping agents away from live environments can now grant access with a clearly bounded permission model.
Soft Navigations Are Finally Measurable #
If your app is a SPA, you’ve been living with an uncomfortable truth: Core Web Vitals only measured full page loads. Route transitions — the actual performance your users experience the most — were invisible to standard tooling.
The October 2026 DevTools update completes end-to-end soft navigation measurement in the Performance panel’s Insights view. An agent profiling your React or Vue app can now identify which route transition is slow and which component inside it is the bottleneck. “Your app feels slow” becomes “/dashboard to /settings takes 1.4 seconds, the DataGrid component is the LCP element.” That’s a different conversation.
Agent Plugins 1.0: A Shared Ecosystem #
V1.9 added support for Agent Plugins 1.0 — a cross-vendor format that packages MCP server capabilities and agent skills into a distributable directory. The same plugin works in Claude Code, Cursor, Gemini CLI, and Zed. Install a browser accessibility auditing skill once; use it with whatever agent you’re running that day.
This is a small structural decision with large downstream consequences. Earlier browser automation ecosystems — Selenium, then WebDriver, then Playwright — each built their own plugin or extension formats, and the ecosystem fragmented. Google is starting from a shared format. Whether that holds as more vendors ship tooling remains to be seen, but it’s the right call.
How to Connect Your Agent #
For Claude Code, it’s one command:
claude mcp add chrome-devtools npx chrome-devtools-mcp@latest
Cursor and Zed users configure through their MCP settings panel. Requirements are Node.js v20.19 or newer and Chrome Stable M144 or newer. The --autoConnect flag lets the agent attach to your existing Chrome session — which means your SSO sessions, extensions, and DevTools panel state carry over.
LY Corporation, one of Japan’s largest internet service providers, used Chrome DevTools for Agents to automate their performance audit process and cut manual analysis by 96–98%. Their specialists wrote the knowledge into an agent skill once; every development team now runs audits on demand.
The Bigger Shift #
The browser has been the one place AI coding agents couldn’t fully reach. They could read documentation, write components, and run terminal commands — but confirming that code worked correctly in a real browser still required a human in the loop. That gap is much smaller now.
Google’s framing for this at I/O 2026 was the “Agentic Web” — a vision where agents move from writing code to writing, verifying, deploying, and monitoring it. The Chrome DevTools for Agents 1.0 release is the practical infrastructure for that vision. The agents have browser eyes now. Use them.