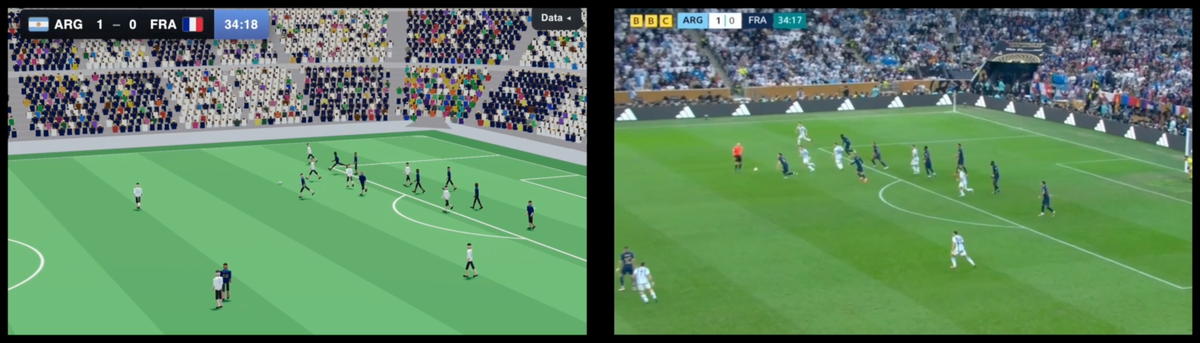
3D reconstruction using player tracking data
Try it out here
A lot of us saw the cool World Cup data visualizations going around social media, like this one from Alexander Bogachev:
I wanted to make my own but go a lot deeper, so I went looking to see where the data comes from.
It turns out a bunch of companies sell data to sports teams and gamblers that they build using computer vision on live broadcasts. It works something like this:
Object detection and OCR for players / ball trackingField geometry identification for coordinate transform (using the penalty box corners, center circle, goal lines)- Mix of inference and human tagging to log events (like passes, interceptions, shots, penalties)
There's a lot more complexity around event tagging and player tracking, which requires visual embeddings for the players to maintain a best guess of their position when their jersey number isn't visible, but this is the high level.
The completeness of this tracking data varies by provider. It generally falls into the following categories:
| Each row | May include | |
|---|---|---|
| Matches | ||
| one match | competition, date, home & away teams, stadium, score / outcome, # periods | |
| Roster | ||
| one player | player name, team, position, jersey number, started? | |
| Events | ||
| one event | event type, timestamp, duration, actor, detail (varies by type) | |
| Tracking | ||
| one frame | each player's XY position, ball XYZ position |
I found 5 providers that offer free data samples for developers. Here's a quick comparison of their level of completeness:
| Source | # Games | What | Frames/game | Link |
|---|---|---|---|---|
| PFF | 64 | Videos + events + tracking | ~160k | |
DataDataDataExample gameSince I'm building high-resolution digital twins of the games, I need a minimum of ~2 data frames per second (~11k frames total). PFF data is the most complete and polished with XY coordinates for all players at 30Hz. This resolution allows us to do any kind of game analysis, or visualization, we want. The data also happens to be from the 2022 World Cup! Other sources had regional league games.
publicationsand helpful
Now let's dig into PFF's data. Here's what it looks like, per game:
- Match: 1KB - Roster: 8KB - Events: ~16-20MB - Tracking: ~0.8-1.2GB
The event data is highly detailed. Below is an example event object from a Messi header initialBodyType:HE
at 13:36 in the Argentina v France final:
{
  "frameNum": 29098,
  "period": 1,
  "periodGameClockTime": 816.417238,
  "game_id": 10517,
  "game_event_id": 6739132,
  "game_event": {
    "game_event_type": "OTB",
    "formatted_game_clock": "13:36",
    "player_id": "1531",
    "player_name": "Lionel Messi",
    "shirt_number": "10",
    "position_group_type": "RW",
    "team_id": "364",
    "team_name": "Argentina",
    "start_time": 970.904,
    "end_time": 970.904,
    "duration": 0,
    "home_team": 1,
    "sequence": 48,
    "home_ball": true
  },
  "possession_event": {
    "possession_event_type": "PA"
  },
  "event_data": {
    "sequence": 48,
    "initialTouch": {
      "initialBodyType": "HE",
      "initialHeightType": "A",
      "facingType": "G",
      "initialTouchType": "S",
      "initialPressureType": "N"
    },
    "possessionEvents": {
      "possessionEventType": "PA",
      "nonEvent": false,
      "ballHeightType": "A",
      "highPointType": "A",
      "passType": "S",
      "passOutcomeType": "C",
      "targetPlayerId": 10715,
      "targetPlayerName": "Julian Alvarez",
      "targetFacingType": "B",
      "receiverPlayerId": 10715,
      "receiverPlayerName": "Julian Alvarez",
      "receiverFacingType": "B",
      "accuracyType": "S",
      "pressureType": "N",
      "createsSpace": false
    }
  }
}
So here's what we want to build: a "video player" for World Cup games, rendering, as faithfully as possible, a 3D stadium, field, fans, and players.
The architecture will be pretty simple:
API server providing a list of available games, player info, and video keyframesStreaming endpoint to deliver XY coordinates for players as the user watches the gameWeb viewer with a game selector and video player
We'll start with a 2D visualization. Claude did a great job parsing the PFF data spec and building a compressed / streamable data format with a simple player to watch the data in 2D. Each game came out to ~100MB split into ~600 10-second files that are requested by the client in sequence as you watch the game. I'm sure this could be optimized further — JSON is not an efficient format.
Very cool! Now let's make it 3D, which of course will require no additional position data. We could just build a 3D stadium and 3D players and have them run around at the same XY coordinates, but this breaks down in cases where the players aren't running, e.g. corner kicks, headers, and injuries.
Also, our player position data is scraped from live broadcasts. On average, for 27% of broadcast airtime the ball is not in play or the camera is running a replay, player closeup, etc, so we don't have player tracking data for those frames. To create a pleasant viewing experience we need to show something else, like a cutscene.
This is where our event data comes in handy. I had Claude build the following player motions and cutscenes which are played when they are triggered by certain events:
| Type | Name | Avg # / game | Avg time / event |
|---|---|---|---|
| Player motion | Run / walk | N/A | N/A |
| Player motion | Header | 93 | 0.9s |
| Player motion | Goalie dive | 8.8 | 3s |
| Player motion | Goal celebration | 2.7 | 20s |
| Player motion | Injury | 30 | 10s |
| Camera angle | Corner kick | 9.0 | 12s |
| Camera angle | Throw-in | 40.9 | 6s |
| Camera angle | Free kick | 28.5 | 8s |
| Camera angle | Penalty kick | 0.4 | 12s |
| Camera angle | Kick off | 4.8 | 10s |
| Referee actions | Yellow/red card | 3.6 | 3s |
| Referee actions | Offside flag | 4.1 | 3.5s |
| Referee actions | VAR review | 0.3 | 5s |
| Referee actions | Substitution | 9.2 | 10s |
We can also create a simulated crowd composed of fans wearing jerseys for the home or away team, who audibly and visibly cheer when their team is advancing or making shots on goal.
Now, putting this all together, we get a decently faithful reproduction of a soccer game in our video player:
Of course we could go arbitrarily higher fidelity but that's not the point. Since we already have the data, we can visualize it any way we want. Here are some aliens playing the 2022 World Cup final on Mars:
I've open sourced the data builder and viewer here. Please fork it and build whatever you want! Hmu on GitHub with any questions ⚽
References: