(Dear reader: this is an unusual post; it gets a bit technical. Alex and I are trying to do something hard here: look at the data and try to understand what they tell us about the intelligence explosion. There is math, Greek letters, and two models. So please bear with us, and if you are bored, apologies. We think it is worth making an exception here.)
Disclaimer: The analysis herein represents the authors’ own research and conclusions. It does not necessarily reflect the official stance, views, or strategic policies of their employers.
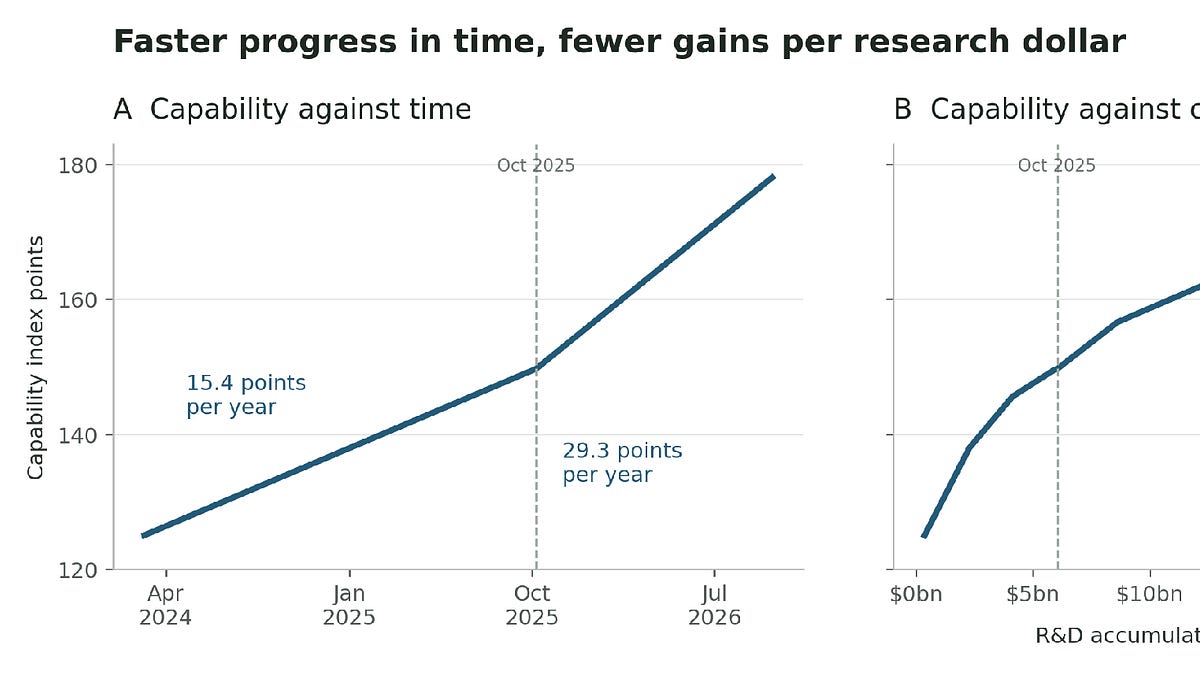
The most important question we are facing today is probably whether we are approaching an intelligence explosion. After a recent report released by METR using internal data from a frontier lab (Anthropic) [2], many researchers and AI analysts have worried (or hoped) that it shows AI advances are accelerating. In a post accompanying Figure 1A, METR says:
“We believe that, as of Oct 2026, the pace of capability growth on well-specified tasks is likely about 2x what it was from Mar 2024 to Oct 2025. We’re highly uncertain and would not be surprised by 1.3x–3x.”
Are we nearing an intelligence explosion? The METR report graphs capabilities against calendar time. But identifying an intelligence explosion requires estimating the pace of output improvements relative to inputs. An explosion requires increasing returns, where each unit of research effort generates more and more proportional progress as capability grows (i.e., the intelligence production function turns convex). In this post, we estimate the research production function and see how far we can get with the data that we have.
While many of their findings are redacted, METR showed that, based on the AECI index used to measure model capabilities, AI systems are improving at about twice the pace they were before October 2025. However, research spending has increased sixfold and the technical workforce has multiplied by three (according to public filings [3, 4, 6], as explained below). Hence capability gains per dollar decreased by two-thirds, while gains per technical employee-year fell by about two-fifths. Putting the data together gives you the two graphs below. Panel A reproduces the METR chart from their report. Panel B shows the same METR index against cumulative research spending (Seb Krier and Ramez Naam published similar graphs as well). It shows that the line on this scale becomes flatter, rather than steeper. That is, the rate of progress is slowing down as a function of the inputs used, rather than increasing, as it does in calendar time.
Exponential increases in capabilities requiring exponential increases in resources is at the heart of the original conceptualization of scaling laws. But the scaling laws are distinct from an intelligence explosion, which requires increasing returns to resources, i.e., fewer inputs to generate the same level of output. The difference between these two possibilities has important implications for humanity: if maintaining growth in capabilities requires ever-increasing research effort, eventually the gains in capabilities will necessarily have to slow down. Capital and the supply of chips and power bound what a lab can spend. Progress does not stop in this case, but slows down to the pace that these constraints allow. Only an intelligence explosion escapes this arithmetic.
This post aims to put some further structure on the data to get closer to answering the question we pose. It has three sections of increasing difficulty, and the reader can stop at any of them and jump to the organizational economics section with an almost complete picture.
The first section documents the relationship between research investment and measured capability. We divide the gains in capability by the research inputs that produced them. We find that progress is faster, but each “unit” of progress takes more and more resources.
In order to draw some inference on the intelligence acceleration, we need to put some structure on the relationship between research inputs and capabilities. In the second section we introduce a simple power law production function, consistent with the usual evidence on the scaling laws. We find that (as in Bloom et al.[1]) ideas are getting harder to find in AI research. In other words, progress would have slowed down if research inputs had been held constant. Progress sped up because inputs grew fast enough to overcome the increasing difficulty of making progress. Introducing a break in the model around October 2025 suggests a one-time step in research effectiveness rather than a continuing acceleration; this is the kind of jump the introduction of coding agents would deliver.
The model we introduce in Section 2 is restrictive. In the third section we generalize the production function by making it more flexible and allowing AI to do research by itself. An intelligence explosion is precisely the case where AI systems do the research that improves them. We use the extension of Aghion, Jones and Jones [14], in which AI can supply research inputs. The model tells us what an intelligence explosion would look like in the data. It is advanced material, only for those in the field or gluttons for punishment, and the reader may jump to the “Lessons from organizational economics” section and the Conclusion without wading through it. In that model, an intelligence explosion needs AI to supply enough of its own research input to more than offset the increasing difficulty of further advances. At least in the available data, we do not yet see convincing evidence that AI is supplying its own research input, which is what an explosion requires.
In sum, both models suggest that we are not seeing an intelligence explosion (yet!).
1. Economic benchmark
The fact that maintaining the speed of advance requires ever-increasing research effort is also at the center of an important paper by Bloom, Jones, Van Reenen and Webb, “Are Ideas Getting Harder to Find?” [1], which motivates a lot of what follows.
Bloom and coauthors consider three case studies. In semiconductors, under Moore’s law, chip density doubled every two years, but sustaining that pace took 18 times as much research effort in 2014 as in 1971. In agriculture, yields of corn, soybeans, cotton and wheat rose by 1.5% a year, but yield growth per unit of research effort decreased by 4–6% a year between 1969 and 2009. In medicine, drugs approved per unit of research effort fell by a factor of five between 1970 and 2014. To obtain these results, Bloom and coauthors divide R&D expenditure by skilled wages, yielding innovation per effective researcher, or per dollar of spending adjusted for skilled wages. The result is not that we are not progressing, but that each “unit” of progress took more and more resources.
To do the Bloom et al. exercise for AI, we must calculate the ratio of capability improvement per year to research effort per year.
In the numerator of this ratio we do not have “intelligence”, as we cannot measure it, but the benchmark AECI used by METR, a test-based capability index. This is Anthropic’s adaptation of Epoch AI’s capability index [2, 9]. It combines performance on different benchmarks, standardized sets of questions or tasks that are used to compare systems. The aim of the index is to allow for differences in test difficulty and to put successive versions of the models on a common scale. METR had access to the true “frontier”, meaning the strongest versions that Anthropic had achieved at a given date, including versions only used internally.
To be able to measure productivity, we need a measure of the denominator, i.e., the research effort. We use public S-1 registration statements, which report research and development expenditure over the period of interest. These figures separate spending on research and model development, the inputs of interest, from other spending such as the cost of serving customers (Appendix D). The numbers are $3.594 billion in January–September 2025 and $19.240 billion in January–September 2026. That is a 5.35-fold increase. (The figures follow US accounting rules; the interim statements are unaudited. [3, 4])
Because the periods in the capability trend (February 2024 to early October 2025, and early October 2025 to late September 2026) differ in length, we express expenditure at an annual rate. It increases from approximately $3.55 billion to $22.00 billion, or 6.19 times.
To compare the rate of increase in labor we use employee-years. The number of technical employees increases from about 630 to 1,960. A caveat here is that we may be overestimating the growth of researchers, since “technical employees” includes a broader group than researchers working exclusively on frontier capabilities. Appendix B explains how we produce this estimate.
Hence AI capabilities improved 1.91 times faster after October 2025, but R&D spending grew 6.19 times and the technical workforce 3.10 times. So measured capability gains per dollar fell by approximately 69%, and measured gains per technical employee-year decreased by 38%. These figures are accounting; nothing causal can be inferred.
Note that over this period, spending grew faster than technical employment: expenditure per technical employee-year approximately doubled. That is consistent with the increasing use of “AI researchers,” leading to more computing resources per worker.
2. Are ideas becoming harder to find?
But the accounting above does not tell us whether the acceleration observed in the METR report signals an intelligence explosion. The test is whether a break is needed to account for the data. The METR chart has one in October 2025: after it, capability improves twice as fast. If the relationship between research effort and progress is the same before and after, no break is needed: the lab paid for the acceleration with more effort. If a break is needed, something did change in October 2025, and we must ask whether it is a one-time step or the start of an explosion.
The accounting exercise we just did cannot tell us which. It shows that returns per dollar decreased: spending multiplied by 6.2 and the pace of progress by 1.9. But two different causes for this are possible. One is congestion: the effort is getting less productive as it increases, because it is hard organizationally to increase the budget by more than five times in a year. The other possibility is that each advance is harder than the last. With enough congestion, these same two numbers are even consistent with each advance making the next one easier, which is what an explosion requires. To know whether a break is needed, we must know what an unchanged relationship would have delivered.
To find out, we use a research production function approach developed by Jones (1995) [8] and built on by Aghion, Jones and Jones (2019; AJJ henceforth) [14] to model how AI could produce an intelligence explosion. It allows the data to speak about acceleration, sustaining progress, and explosion.
Appendix F outlines the details of how we estimate this model, as well as alternative specifications. We describe here the basic set-up. The model starts from the assumption that the growth of the stock of productive knowledge increases as a function of inputs and previous knowledge.
A is a stock of productive knowledge, g<sub>A</sub> its growth rate, X is research input and δ summarizes research effectiveness. λ is the elasticity of new knowledge with respect to current research effort; if λ < 1, doubling spending less than doubles the creation of new ideas, for instance because researchers duplicate each other’s work. We refer to this effect as congestion. ϕ describes how the existing knowledge stock affects the production of further knowledge. [5]
A power function is natural here, since it makes the parameters elasticities: a 1% rise in inputs raises the pace of progress by λ%, at any scale. The scaling laws of machine learning are power laws: e.g., Kaplan et al. (2020) [12] find that a model’s error falls as a power of training compute. So are the experience curves of manufacturing. Also, Kortum (1997) [15] shows that if research is a search for ideas whose quality follows a power-law (Pareto) distribution, knowledge is a power function of cumulative research. Indeed, previous research on scaling laws (Whitfill et al. [13]) uses this production function to link the growth in METR’s task horizon to the growth of OpenAI’s compute.
If the index is used as a proxy for growth in A, comparing across periods then gives: Hence the model allows us to decompose technological progress into two parts: how much faster capability improves because more is spent on research, where λ is the response of progress to research inputs; and the return to progress as capability grows, ϕ − 1. The residual is any change in research effectiveness δ. In this model, the central parameter for assessing an intelligence explosion is ϕ. If ϕ is below one, each additional increase in intelligence makes the next advance harder to obtain; with constant inputs the growth rate falls to zero. Sustaining growth means ever-growing input. This is what Bloom and coauthors mean when they say ideas are getting harder to find. If ϕ is one, intelligence reproduces itself in the sense that growth keeps going at a constant rate even if there’s no increase in inputs. The real explosion happens when ϕ is above one; here, each advance makes the next advance easier, so that growth accelerates and intelligence begins to “explode.”
Estimating the model
The two panels in Figure 3 illustrate our estimates from looking at the entire available data set. Panel A shows the model fitted to all sixteen capability observations. The dashed line is METR’s estimated trend; the colored lines are the model estimates using research expenditure or a measure combining computing expenditure and technical employment. The estimated model produces an acceleration of about 1.8 times, close to the observed 1.9 times, without any change in research effectiveness (we relax this assumption below). Research effectiveness here means how much progress a given expenditure produces at a given capability level. The good linear fit is in line with the scaling law of Sutton [11], given this quantitative form by Amodei and his coauthors in Kaplan et al. [12], although in research spending rather than training compute: when inputs grow at a constant rate, the index increases in a straight line whose slope is proportional to the growth rate of inputs.
Panel B is our attempt to assess whether ideas are getting harder to find. Recall that returns can fall because of congestion or because each advance is harder than the last. The data cannot separate the two stories. So Panel B shows the answer for every level of congestion. The congestion level (λ) is on the horizontal axis (at 1 there is no congestion; lower values mean more) and ϕ on the vertical, where any value below one means that each advance makes the next one harder: ideas are getting harder to find. The more congestion we assume, the closer ϕ gets to one (high congestion is compatible with ideas getting easier), which is why the lines slope down. In our estimates ϕ is below one in almost every specification: it takes a central value of 0.84 (the dot), and is in a range of about 0.66 to 0.94 when we fit the full sample without a break (Appendix F, Table F1). The lines reach the red area, where progress would accelerate on its own with fixed inputs, only if congestion is very severe: λ below about 0.3 to 0.45. Estimates of ϕ are lower in the alternatives discussed below, which allow for a break in October 2025.
Together, these parameters suggest that ideas become harder to find, but inputs grow fast enough to overcome that difficulty and produce faster progress.
Robustness is in the appendix, but we find that ϕ is below one whether inputs are dollars, number of employees or a mix, with or without lags, under the different index versions (see Appendix F, Table F1 and Sections F4 and F6). We now consider alternative specifications that allow for a break.
Is a break needed in October 2025?
The METR report suggests a break in the pace of progress in October 2025. To assess this, we estimate the model on the six observations before October 2025 alone, hold the parameters fixed and feed in the inputs actually observed afterward (Appendix F3). With only six observations to estimate three parameters this is a bit heroic, but still worth considering given the inferences drawn in the report. On this test the model under-predicts what followed: the surge in inputs accounts for at best half of the acceleration. A model with a break estimates a one-time step of 1.4 to 2.3 times in research effectiveness (Appendix F, Table F3).
We find that allowing for a break does not alter the conclusion that ϕ is below one. Estimated separately, the periods before and after October 2025 show similar values of ϕ, that is, similar rates of diminishing returns, suggesting that the change was a one-time step rather than a continuing acceleration (Appendix F8). This may be consistent with, for example, the introduction of coding agents.
In short, we find the evidence pointins to ϕ below . Holding inputs fixed, progress would slow. Progress sped up because inputs grew. The acceleration since October 2025 combines faster input growth with a one-time step in research effectiveness.
3. A more general model of what AI can do
This section is advanced material with some more math in it. It discusses a model where AI can supply research inputs. You can skip it and go straight to “Lessons from organizational economics” without losing the thread.
Jones’s model has no explicit AI in it. AJJ [14] add it: it assumes that once AI performs research, effective research input grows in proportion to capability raised to a power ψ. This creates a positive feedback loop, in which more capable AI supplies more research input, and more research input makes AI more capable. When λψ + ϕ > 1, combining AI feedback ψ with Section 2’s input elasticity λ and knowledge returns ϕ, progress explodes even when ideas are getting harder to find (ϕ < 1).
What matters then, as Jacob Schaal notes, is the return per doubling: how many doublings of capability each doubling of research input buys. On our estimates, each doubling of R&D spending has brought about two to three doublings of METR’s task horizon (Appendix F7). The task horizon is the length of task a model can complete; about five index points double it. Falling returns per dollar and steady returns per doubling are two sides of the same result: each doubling costs twice as many dollars as the last. For the loop to take off, each doubling of capability must supply enough new research input to buy more than one further doubling.
Has the loop begun? If it had, capability would begin to pull away from spending. This does not seem to be the case in the available data. If AI were already supplying unpriced research input atop budgets, diminishing returns per dollar would weaken after October 2025; instead, pre- and post-October estimates match, implying ψ near zero (0.01 to 0.04, or 1% to 3% more input per horizon doubling). An explosion needs ψ above (1 − ϕ)/λ: about 0.34 to 0.46 (a 26% to 38% input rise per doubling), or 0.8 to 1.0 for labor if compute is fixed, though error bands remain wide (Appendix F7–F8). Per Tyler John’s reading of METR’s staff interviews, the introduction of AI tools removed implementation frictions but did not supply new ideas. This would raise the level of capabilities, but keeping up the current pace would still require inputs to keep growing about fourfold a year (Appendix F8).
The data we have access to come from a period in which research inputs were purchased. They can show whether such feedback has already begun. However, they say little about its size once AI does most of the research.
4. Lessons from organizational economics
In sum our finding is consistent with that of Bloom and his coauthors: ideas are getting harder to find in AI too, and maintaining the rate of improvement requires ever larger increases in inputs.
An organizational mechanism for this comes from “Organizing Growth,” Luis’s 2012 Journal of Economic Theory paper with Esteban Rossi-Hansberg [7], which develops an organizational account of how technological progress can coexist with diminishing returns. A new technology creates new problems that people must learn to solve. They initially acquire knowledge of the most common problems; organizations then develop increasingly specialized workers who can deal with the more unusual problems. Each step makes the technology more productive, but the gains diminish because fewer and fewer problems require additional expertise. Knowledge continues to accumulate, but it contributes less to moving the frontier further.
In that model, growth requires developing and adopting new technologies, so that a new cycle of learning and organizational development can start. Hence declining measured research productivity while investment increases can be an equilibrium outcome, rather than a sign of irrationality. Demand for more capable systems can justify increasing effort even as further improvements become more resource-intensive, because the returns are out there.
5. Conclusions
We estimated the research production function of Jones and AJJ using available data. We believe that the data suggests we can support four claims.
First, ideas are getting harder to find. Holding inputs fixed, progress would slow down. (That is, in terms of the model, we find that ϕ is below one).
Second, progress sped up because of the increase in research effort. Each doubling of R&D spending led to doubling by two to to three times the task horizon, before and after October 2025. Keeping up the current pace would require to multiply spending by four each year.
Third, the acceleration since October 2025 is the result of faster growth in the research effort together with a one-time jump in research effectiveness. The evidence suggests that the rate of diminishing returns is the same before and after. (In terms of the model, the estimates put the jump δ at 1.4 to 2.3 times, depending on how we measure the research effort).
Fourth, there is no strong sign yet of AI supplying its own research input.
The data say little about what happens once AI does most of the research. That depends on how much research input AI can supply, and on whether compute becomes the bottleneck.
Two caveats apply to our analysis. First, decreasing capability gains per dollar do not imply decreasing financial returns. A small improvement in an AI system can make it useful for a task it could not perform before. The economic value of an index point need not be constant.
Ben Todd makes this point by arguing that we should focus on revenue as the relevant output. As an illustration, he says that a Claude model at an index of 130 could earn about $0.3 billion a year, one at 150 about $10 billion, and one at 170 about $60 billion, so each recent point has been worth far more revenue than earlier ones. Based on these numbers, reinvested revenue still more than covers the rising cost of research: revenue rose about 9% per index point between 150 and 170, while the spending needed to hold the pace of progress rises about 5% to 7% per point. This helps explain why investment keeps growing. It is also the economic feedback loop in models of an intelligence explosion [10, 14]: higher output finances further research. But revenue is a tricky measure of model capabilities, because it also depends on natural diffusion, marketing, market competition, etc. For example, if OpenAI and Anthropic had similar AECI improvements over the period, the two show very different relationships between the index and revenue: Anthropic’s revenue rose with the index (though more slowly from Q2 to Q3), while OpenAI’s was mostly flat before a more recent acceleration. Another option would be to use a benchmark that explicitly tracks economic capabilities, e.g., GDPval. Here, we see an almost perfectly linear relationship between AECI and GDPval scores (though we can only do this for released models).
Second, we are mindful that one could have drawn these graphs last summer using mathematics research, make the observation that innovation was not meaningfully accelerating, only to be surprised by the huge burst of progress starting in September and October 2026. Hence nothing here allows us to rule out a huge burst in improvement as recursive self-improvement takes place and the models can become their own researchers.
- Bloom, N., Jones, C. I., Van Reenen, J. and Webb, M. (2020). Are Ideas Getting Harder to Find?American Economic Review , 110(4), 1104–1144.
2. METR (2026). [Independent Assessment of AI R&D Acceleration at Anthropic in October 2026](https://metr.org/blog/2026-11-05-anthropic-ai-rd-acceleration-assessment/) , 5 November.
3. Anthropic (2026). [Registration statement on Form S-1](https://www.sec.gov/Archives/edgar/data/2130357/000162828026067168/anthropicpbc-sx1.htm) , 26 October, especially Note 8.
- Anthropic (2026). Amended registration statement on Form S-1/A , 2 November, especially Note 8 and the discussion of compute expenses.
- Jones, C. I. (2022). The Past and Future of Economic Growth: A Semi-Endogenous Perspective .Annual Review of Economics , 14, 125–152.
6. Anthropic (2026). [How employment is changing at Anthropic](https://www.anthropic.com/research/employment-at-anthropic) , 16 October.
7. Garicano, L. and Rossi-Hansberg, E. (2012). [Organizing Growth](https://doi.org/10.1016/j.jet.2009.11.007) .*Journal of Economic Theory* , 147(2), 623–656.
8. Jones, C. I. (1995). [R&D-Based Models of Economic Growth](https://web.stanford.edu/~chadj/JonesJPE95.pdf) .*Journal of Political Economy* , 103(4), 759–784.
- Epoch AI (2026). ECI documentation FAQ , accessed 8 November. The five-point relationship is described as an approximate observation at the index’s launch.
- Davidson, T., Halperin, B., Houlden, T. and Korinek, A. (2026). When Does Automating AI Research Produce Explosive Growth? Feedback Loops in Innovation Networks. NBER Working Paper 35155, April.
- Sutton, R. (2019). The Bitter Lesson. Essay, 13 March.
- Kaplan, J., McCandlish, S., Henighan, T., Brown, T., Chess, B., Child, R., Gray, S., Radford, A., Wu, J. and Amodei, D. (2020). Scaling Laws for Neural Language Models . arXiv:2001.08361.
- Whitfill, P., Snodin, B. and Becker, J. (2025). Forecasting AI Time Horizon Under Compute Slowdowns . arXiv:2511.19492, 23 November.
- Aghion, P., Jones, B. F. and Jones, C. I. (2019). Artificial Intelligence and Economic Growth. In A. Agrawal, J. Gans and A. Goldfarb (eds.), The Economics of Artificial Intelligence: An Agenda . University of Chicago Press. NBER Working Paper 23928.
- Kortum, S. S. (1997). Research, Patenting, and Technological Change. Econometrica , 65(6), 1389–1419.