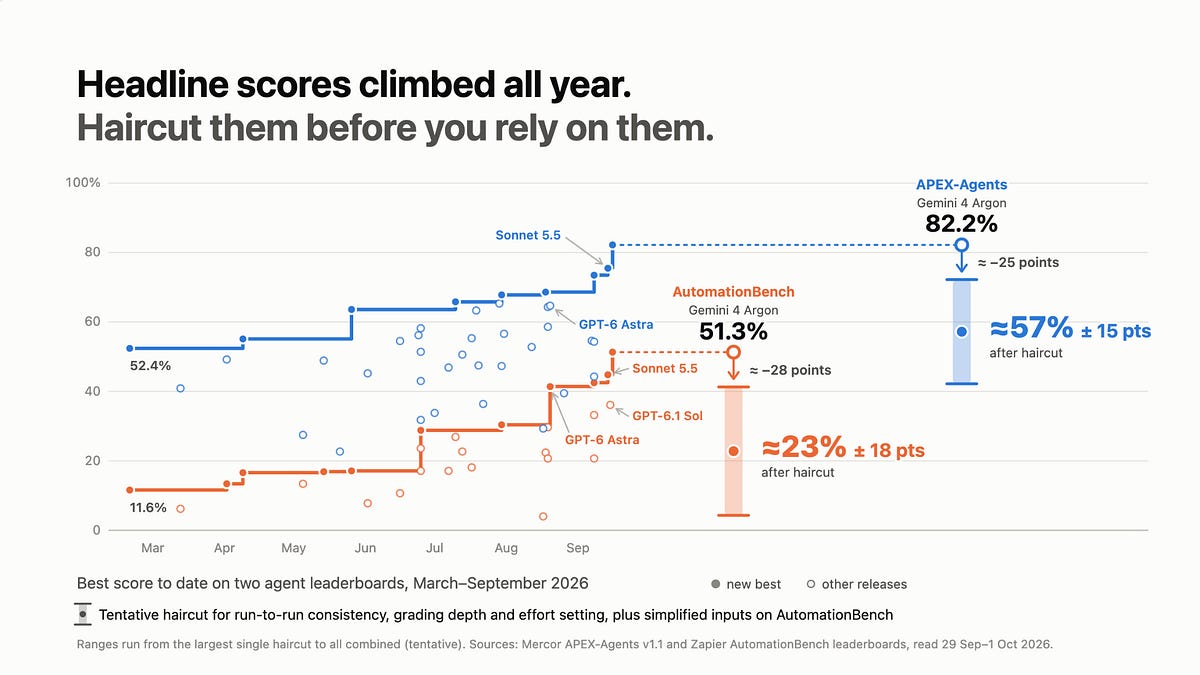
Every finance professional knows what to do with an Adjusted EBITDA from management case: scrutinize and likely haircut it. The numbers aren’t made up, but someone else built them, on assumptions that you don’t necessarily agree with.
AI benchmark scores deserve the same treatment. Headline scores come with add-backs of their own: clean inputs, a single averaged run, light grading and simplified running environments.
We are living in a time when the “frontier” gets refreshed every month or even week. On one leaderboard of banking, consulting and legal tasks, the top score rose from 52.4% in March to 82.2% in late September [1]. While writing this post, we have to update the numbers almost every day.
Heard about the transformative experience from your friends in Software Engineering, you give it a try in ChatGPT or Claude Cowork, it seems impressive – upload a financials and an agreement, ask for a comps table or a covenant summary, and what comes back seems right.
Then you hand the model a workflow that actually matters: pulling this month’s numbers for the eight portfolio companies you follow into the board pack. Each company reports in its own format, and one has just restated last quarter. You spot-check a few figures and find a mistake. Now you’re running into a rabbit hole, going back through all eight to see what else is hiding and tracing every number to its source. By then, you might as well have done it yourself.
Having been deploying agents on deal work and portfolio operations for leading funds and investment banks over hundreds of thousands documents and numerous workflows, we have seen this crash landing from off-the-shelve adoption of AI models repeatedly. This is why: A leaderboard asks how often a model, in one setup, passes one set of checks. A professional team asks whether an analyst can rely on the output, or at least check it quickly. Our own benchmarks ask the second question.
So we took apart four widely cited public finance-agent benchmarks focusing on long-horizon and end-to-end tasks, and 3-rd party independent leaderboards for them [15], to see what their scores measure. Combined with detailed analysis and our experiences building internal benchmarks, we come up with an estimated “Add-backs Bridge” to help disect the gap. On a benchmark built from U.S. Treasury Bulletins raw files [9], handing models clean text of the right pages raised scores more than the model capability advancements in those released between February and July did. On another benchmark [7], we wrote an answer no analyst would sign off on, and it would score seven out of seven with perfect pass.
1. Real documents are not clean filings
Public filings are standardized; deal materials and financial models are not. A typical public-filing benchmark names the target company and lets the model run full-text search over SEC EDGAR [5]. Standard 10-K filings follow predictable section layouts, use XBRL tagging, and come as standardized HTML rather than scanned PDFs, so an agent that can navigate to these known anchors skips the hardest retrieval steps. Deal work depends on confidential information memoranda (CIMs), credit agreements, management presentations, and scanned amendments with handwritten annotations. Section taxonomies vary, formatting breaks across pages, key metrics live only inside embedded charts or images, and financial definitions drift across documents. Financial models are worse: real ones routinely span dozens of worksheets with hardcoded overrides, external links and parallel versions of the same schedule, nothing like the tidy single-tab workbooks common in public evaluation suites.
Document discovery and contextual retrieval are skills of their own. By pre-selecting the relevant files, benchmarks skip the core challenge of data-room discovery [6, 7], while in real diligence, working out which version of a document governs is one of the main hurdles. An agent has to tell whether a file like “Budget FY25 v7 FINAL” is the board-approved baseline or just another draft. Data rooms or shared Box drive lists hundreds of folder paths with similar file names all at once. Critical covenants and restatements also tend to hide in footnotes or embedded definitions, which standard vector chunking often fails to retrieve [8]. None of the public benchmarks we reviewed isolates or evaluates this capability.
Pre-parsed text hides ingestion failures. On OfficeQA Pro, a benchmark built from U.S. Treasury Bulletins, giving the same models clean text of just the target pages raised their scores by 19 to 29 percentage points, while newer models released between February and July added only 10 to 19 points on raw PDFs [9, 10] (Figure 2). Clean text of all the files, without picking the pages, was worth 6 to 20 points on its own. Giving an agent pre-extracted text removes optical character recognition (OCR), layout parser, and table extraction steps—exactly where document pipelines most often break in production. Flattening tables into text can also detach figures from their column headers, or footnote markers from the rows they qualify. So evaluations on pre-parsed text measure reasoning conditional on perfect extraction. That is fine for measuring reasoning in isolation, but the benchmark was built for end-to-end work on raw documents. Model cards often themselves cite it under “real-world professional tasks” while running it on extracted text, sometimes even with the documents preselected [3]. We have to ask, how much of the impressive headline scores are actually meaningful for real work?
2. A single average hides reliability
For autonomous pipelines or any task you run repeatedly, an aggregate pass rate tells you very little. A deployment needs clear boundaries: which task types can run unattended, which need a reviewer, and which should stay fully manual. Because public leaderboards typically report single-run or low-sample averages, they hide exactly this variance. The one benchmark that tracks multi-run consistency shows how large it is. In its original release, commercial agents’ Pass^8 (passing all eight runs) was 10 to 12 points below their Pass@1 (the average run) [7]. In the current version, the spread between solving a task at least once in four attempts (Pass@4) and solving it on every attempt (Pass^4) runs from 17 to 31 percentage points [11]. Every score hides two distinct sources of variance. Execution variance occurs when a model nondeterministically succeeds or fails across identical runs of the same task. Task difficulty variance reflects the wide spread in task complexity across the benchmark dataset, where estimated expert completion times range from 15 minutes to six hours [5, 11]. When task difficulty is highly non-uniform, single-run sampling cannot distinguish between a fundamentally unachievable task and a stochastic task with a 50% success probability. The average tells you how often a model succeeds, not when.
Multi-run evaluation isolates these dynamics. Defining task success rate as cᵢ passes out of n attempts across T tasks, the expected single-run accuracy is Pass@1 = (1/T)·Σ (cᵢ/n). The reliability metric Pass^k—introduced by τ-bench [12]—measures the probability that k independent executions all succeed, calculated as C(cᵢ, k)/C(n, k) averaged across tasks. Figure 3 shows two hypothetical systems with an identical Pass@1 of 64.1%. Model A (calibrated to GPT-6 Astra) passes the same 9 of 16 tasks in every run (Pass^4 = 56.3%), while Model B drops to Pass^4 = 37.5% because six of its tasks flip between pass and fail.
Standard leaderboards rank Model A and Model B identically. But which one would you put into production? Model A, because its stable boundary lets you route the tasks it handles to automation and send the rest to people.
Two problems remain even for a perfectly consistent model: a small test set makes the score imprecise, and a pass rate ignores how bad the misses are. On a sample set of 120 finance tasks with a top pass rate near 43%, a 95% confidence interval spans approximately ±9 percentage points by our calculation—a margin wider than the gap between many leading models [2]. Furthermore, binary scoring treats minor formatting mismatches identically to critical quantitative errors, despite expert graders rating roughly 29% of one frontier model’s losses as bad or catastrophic [6].
Because current models can’t run unmonitored, their practical value comes down to how quickly a person can review what they produce.
3. Rubrics check that the answer appears, not that it holds up
Most agent evaluations rely on rubrics made of short, discrete assertions (e.g., “States Cost of Equity is 7.94%”). A task either passes only when every assertion holds, or earns partial credit for the share that does.
Traceable citations determine how fast review goes. Because model outputs vary from run to run, a human still has to verify them, so the real time saved is the time to do the task minus the time to check it. An output with precise inline document citations can be verified in seconds; an ungrounded calculation forces the analyst to re-derive the logic from scratch. Yet public benchmarks rarely grade citation accuracy or source grounding. One benchmark requires a list of sources, but none of its 239 public checks verifies that a cited source supports the claim it’s attached to [5].
Standard rubrics check for assertion presence rather than factual precision. Most criteria only check whether the expected value appears in the output. So what stops an agent from hedging? Nothing: list several candidate figures and one of them will match. In finance, a false statement sitting next to correct ones is the expensive kind of error, such as the correct EBITDA reported beside the wrong leverage ratio. Checks that explicitly penalize false statements (“States X and contains no contradictions”) are rarely implemented or factored into official leaderboard scoring.
Figure 4 shows this failure mode. We built the response against the published rubric of one investment-banking task, and it satisfies all seven criteria, so it scores as a pass. Yet it also includes incorrect standalone EPS figures, inaccurate share counts, and an investment recommendation that directly contradicts the underlying dilution metrics.
4. Real work runs in live systems and ends in a sign-off
Real financial tasks rarely arrive fully specified. A request like “Update the leverage analysis for the revised deck” requires confirming which EBITDA definition applies and whether the sponsor’s email changes the base case, which an analyst settles with one targeted question. The work then moves across data rooms, financial models, email and accounting systems under a deadline. It is finished only when someone who knows the deal reviews it and signs off. Existing benchmarks simplify this in four ways:
- No way to ask clarifying questions. Tasks are typically formatted as single-turn, fully specified prompts [6]. One harness explicitly tells agents not to ask clarifying questions and ends the run as soon as the model replies without calling a tool, so the model has to guess [13].
- Tools and environments are simplified. Benchmarks run agents in closed, static sandboxes. AutomationBench’s 47 apps are in-memory simulations, reached through two generic tools: a keyword search over hundreds of API endpoints and a fetch. Even their noise is seeded, so every run sees the same quirks [13, 14]. APEX-Agents gives each world a fixed set of about 170 files and nine apps, with web search turned off [7]. Real work runs in live systems: models linked to other workbooks, data rooms with permissions and version histories, and accounting systems that other people are changing at the same time.
- Grading reads the output, often through a weaker model. In a benchmark built on business software, about two-thirds of the checks on the public finance tasks read the agent’s outgoing email, and under 10% check the books in QuickBooks, Xero or Wave [14]. Destructive side effects go unscored: one team found 36 runs in which agents deleted workspace files, and none was penalized [7]. Checks that need judgment go to an LLM judge, often a lightweight model such as Gemini 3 Flash or a DeepSeek Flash variant [7, 11] that may be less capable than the agent it grades. None of the benchmarks we reviewed re-grades an output to see how often the verdict flips.
- Inconsistent time and cost limits. Turn limits and wall-clock execution caps vary widely across benchmarks (e.g., 50 turns vs. two hours). On identical tasks, token use can differ by more than 10x between models [7]. A deployment has to fix one side and optimize the other: the best accuracy within a time and cost budget, or the lowest cost that reaches a target reliability.
Configuration settings can move scores sharply. On an identical 240-task benchmark suite, Claude Opus 5.5 achieved a 73.5% pass rate under maximum reasoning settings compared to 52.5% at medium reasoning depth [1]. An evaluation is only useful if it runs the model the way you will deploy it.
What to do with a headline score #
So what do current public benchmarks measure? Mostly whether an agent can pull the right numbers from clean inputs, in one shot, with no real deadline. That measures real reasoning ability, but it isn’t what you feel in day-to-day work, where the value lies in output an analyst can verify and sign off.
When you rely on public benchmark scores, read the fine prints and check the methodology. Look at the input format (raw PDFs or pre-parsed text), how many runs sit behind each score, whether the rubric penalizes wrong content, and which judge did the grading. Then haircut the headline pass rate for every way those conditions differ from your own workflow, using the table at the top.
If you can, build your own evaluation suite. Sample your real workflows and build the suite to these standards, which double as a checklist for judging anyone else’s:
- Inputs: If applicable, supply raw, unparsed files, including scanned PDFs and complex workbooks, organized as a realistic data room, and report accuracy with and without pre-extracted text.
- Reliability: Run each task at least five times and report Pass@1, Pass^k, and the proportion of tasks with non-deterministic results (0 <cᵢ <n ), providing confidence intervals and paired model comparisons.
- Checks: Verify that cited sources support each claim, check numbers against explicit tolerances, penalize contradictions, hallucinated figures and unrequested changes, grade the final deliverable, and fail hedged answers.
- Judge: Validate the LLM judge against domain experts for each model family it grades, re-grade outputs to test its consistency, and publish its prompts.
- Environment: Run agents in the environment you would deploy, with real integrations such as data rooms, Excel, email and ERP systems; allow and credit clarifying questions, and grade side effects in the system of record.
- Budget: Measure pass rates under fixed time and token budgets, and the resources needed to hit a target reliability.
- Sign-off check: On a representative sample, test whether rubric scores predict expert sign-off, and measure how much rework is needed.
Treat every AI benchmark score like a management case: haircut it, or build your own evaluation suite.
References
1. Mercor, APEX-Agents leaderboard (v1.1), read 22 and 29 September 2026: [https://www.mercor.com/apex/apex-agents-leaderboard/](https://www.mercor.com/apex/apex-agents-leaderboard/)
2. Zapier, AutomationBench leaderboard, read 29 September 2026: [https://zapier.com/benchmarks](https://zapier.com/benchmarks)
- Anthropic, Claude Sonnet 5.5 system card: https://www-cdn.anthropic.com/870c8f525702625d2c62fc6dd04c857e3250bec1/Claude%20Sonnet%205.5%20System%20Card.pdf
- OpenAI, Introducing GPT-6.1 Sol: https://openai.com/index/introducing-gpt-6-1-sol/
- Vals AI, Finance Agent Benchmark v2: https://www.vals.ai/benchmarks/fabv2 · harness:https://github.com/vals-ai/finance-agent-v2 · v1 paper:https://arxiv.org/abs/2508.00828
- OpenAI, GDPval: https://arxiv.org/abs/2510.04374 · dataset and rubrics:https://huggingface.co/datasets/openai/gdpval
- Mercor, APEX-Agents paper: https://arxiv.org/abs/2601.14242 · grader:https://github.com/Mercor-Intelligence/archipelago · dataset:https://huggingface.co/datasets/mercor/apex-agents
- IPO Finance Agent (critique of the FAB harness): https://arxiv.org/abs/2606.23032
- OfficeQA Pro paper: https://arxiv.org/abs/2603.08655 · Databricks, OfficeQA:https://www.databricks.com/blog/introducing-officeqa-benchmark-end-to-end-grounded-reasoning
- Databricks, OfficeQA repository (re-graded runs, 21 July 2026): https://github.com/databricks/officeqa
- Mercor, Introducing APEX-Agents 1.1: https://www.mercor.com/blog/introducing-apex-agents-1-1/ · dataset:https://huggingface.co/datasets/mercor/apex-agents-v1.1
12. τ-bench (pass^k): [https://arxiv.org/abs/2406.12045](https://arxiv.org/abs/2406.12045)
13. Zapier, AutomationBench paper: [https://arxiv.org/abs/2604.18934](https://arxiv.org/abs/2604.18934)
14. Zapier, AutomationBench repository (harness code and public tasks; our counts at commit 4a8e106): [https://github.com/zapier/AutomationBench](https://github.com/zapier/AutomationBench)
- Artificial Analysis, methodology (GDPval-AA, AutomationBench-AA, APEX-Agents-AA): https://artificialanalysis.ai/methodology/intelligence-benchmarking