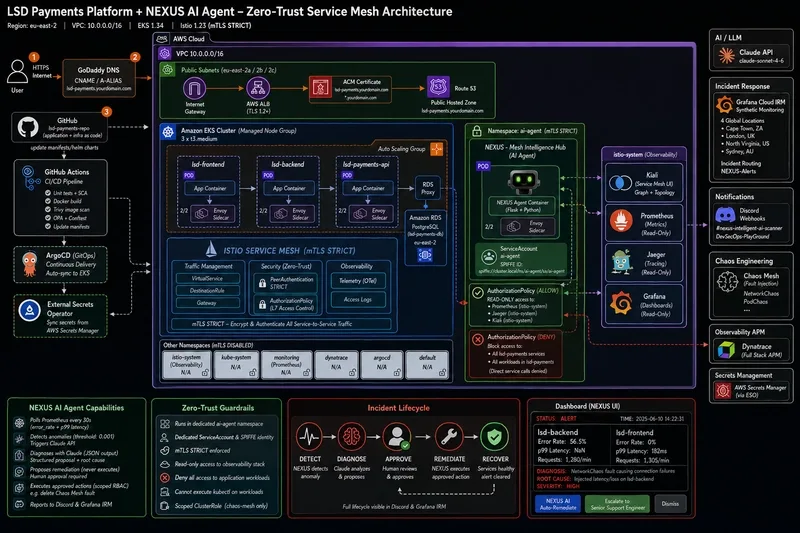
I've been looking into how to solve this using a Zero Trust approach, specifically by combining an LLM agent with an Istio service mesh. I call this architecture NEXUS (Mesh Intelligence Hub). The core philosophy is simple: the agent should be able to observe everything and propose solutions, but it should be physically impossible for it to actually touch or modify the workloads it monitors.
The Architecture: Security via Service Mesh #
Instead of relying on the agent "promising" to be well-behaved, we use the platform to enforce boundaries. In my setup on Amazon EKS, the agent runs in its own isolated Kubernetes namespace with a dedicated ServiceAccount and a SPIFFE cryptographic identity:
spiffe://cluster.local/ns/ai-agent/sa/ai-agent
By using Istio in STRICT mTLS mode, we can move away from traditional IP-based security to identity-based security. Here is how the enforcement works:
Read-Only Access: AnAuthorizationPolicy
is configured to allow the agent to pull data from Prometheus, Jaeger, and Kiali.Explicit Deny: A separate policy explicitly blocks the agent from reaching any actual application workloads (like payment APIs or frontend services).
Even if the LLM hallucinates a command to delete a namespace or if the agent itself is compromised, the service mesh acts as a hard physical barrier. The blast radius is effectively zero.
The AI Workflow: From Telemetry to Structured Diagnosis #
The agent doesn't just "chat" with the system. It follows a rigorous, automated loop. Every 30 seconds, it polls Prometheus for two specific metrics per service:
- Error rates (derived from
istio_requests_total
)
- p99 latency (from histogram buckets)
When a threshold is crossed, the agent pulls a full telemetry snapshot and sends it to Claude 3.5 Sonnet. The key here is the prompt engineering. To make this useful for a real-world SRE dashboard, the agent must not return conversational text. It must return structured JSON.
Here is the prompt template I used to ensure the output remains machine-readable and strictly bounded:
You are an expert Site Reliability Engineer. Analyze the provided telemetry snapshot and identify the root cause of the anomaly.

Your output must be a valid JSON object ONLY. Do not include markdown formatting, preamble, or conversational text.

The JSON schema must follow this structure:
{
  "severity": "critical|warning|info",
  "summary": "A concise one-sentence description of the issue",
  "root_cause": "Detailed technical explanation of the failure",
  "remediation_steps": [
    "Step 1...",
    "Step 2...",
    "Step 3..."
  ],
  "scope_boundary": "Explicitly state what actions you are physically unable to perform",
  "required_approval_role": "The specific IAM or RBAC role needed to execute these steps"
}

Telemetry Data:
{{telemetry_snapshot}}
Real-World Test: Chaos Engineering #
To see if this actually worked, I used Chaos Mesh to inject a NetworkChaos
fault into a backend service.
The results were impressive. Within one polling cycle, the agent detected a 56.5% error rate. Because it had access to the mesh telemetry, it didn't just say "the network is down." It correctly isolated the fault to the specific backend service, ruled out a mesh-wide issue, and identified that the NaN
p99 latency values were actually a sign of a broken metrics pipeline rather than a slow application.
Most importantly, the scope_boundary
field in the JSON output correctly stated: "I cannot execute kubectl commands or modify cluster state." This is the kind of predictable, constrained AI behavior we need for production deployment.
Next Hands lets your LLM agent control your actual Windows desktop →
these AI tool field notes, with plenty of directly applicable cases.