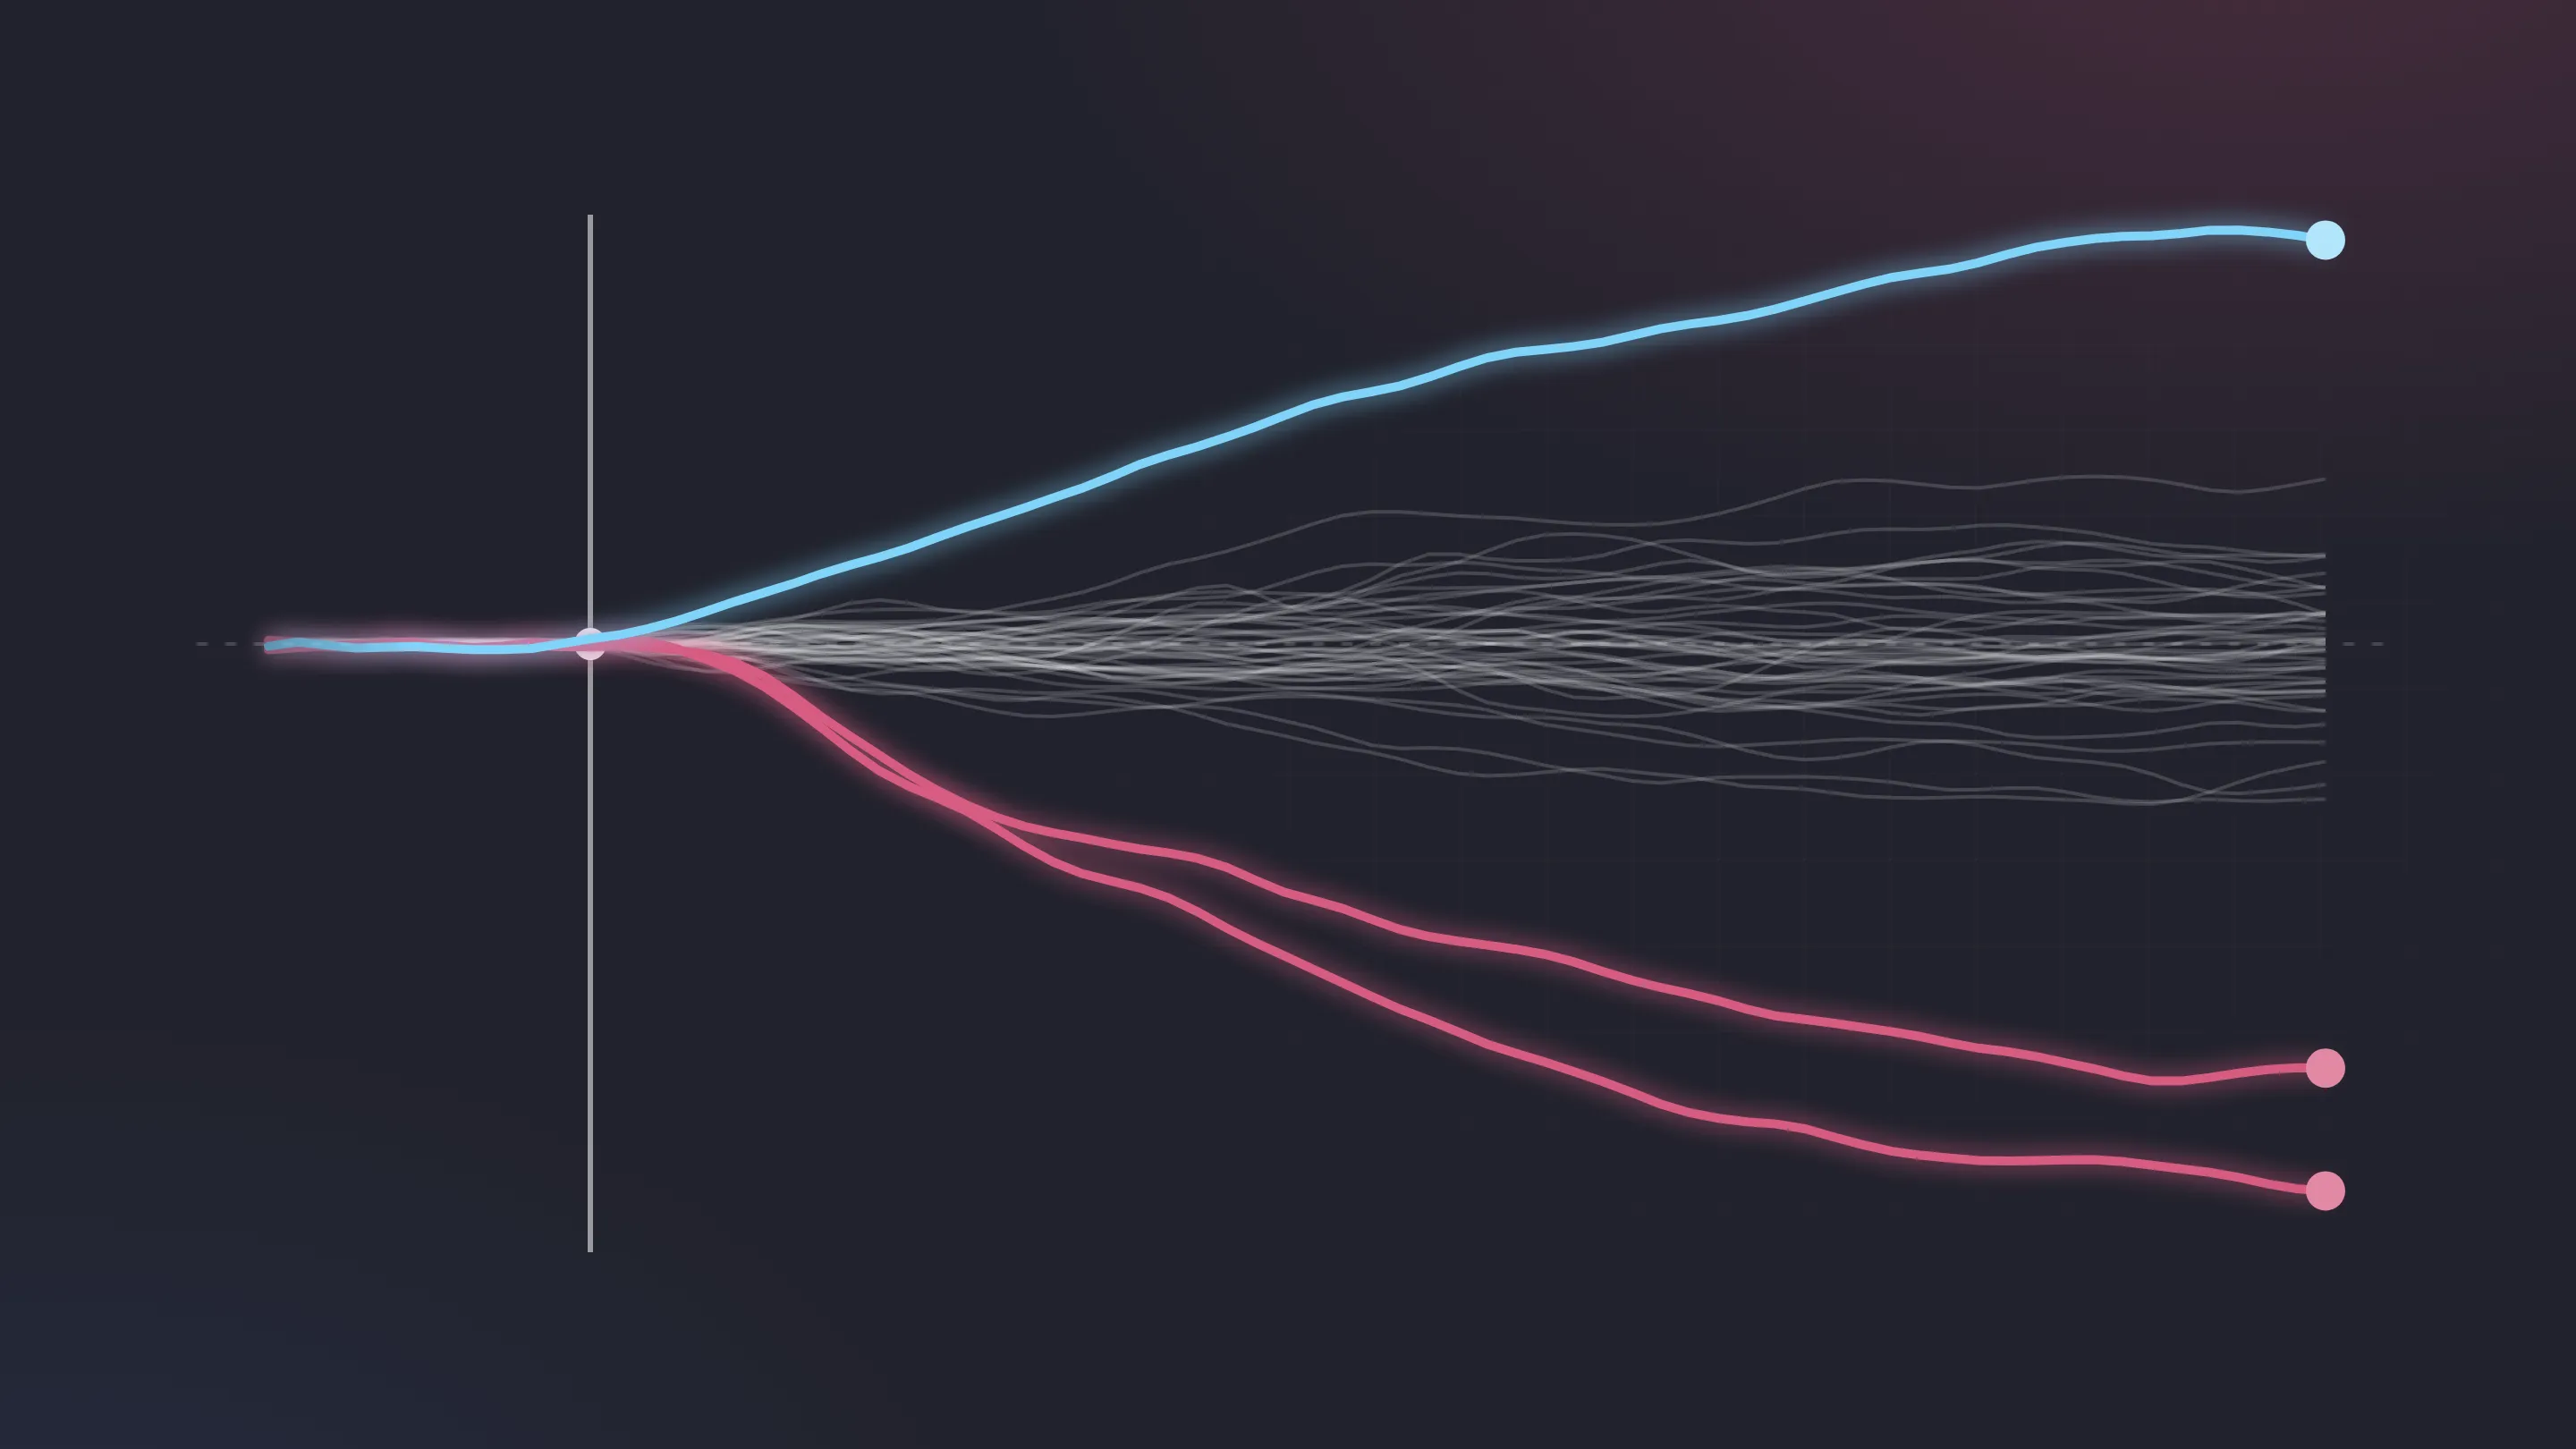
We gave AI coding agents a trading desk with planted problems, the QuestDB skill and MCP server, and one question: is anyone picking us off? Markouts, adverse selection and transaction cost analysis, scored against the answer key, with every finding reproducible in SQL.
After a trading desk buys or sells, does the price keep moving against it? If it does, again and again, the traders on the other side probably knew something the desk didn't. Desks call that getting picked off, and finding out whether it's happening is one of the oldest questions in transaction cost analysis (TCA). Answering it properly takes more than one query. You have to find the fills, pair each one with the market before and after it, separate the cost of crossing the spread from adverse selection, work out who was on the other side, and rule out everything that only looks like a problem: a market that moved for everyone, a stale quote, a ticket booked twice.
Every database now calls itself agent-ready. We wanted that claim to mean something observable, so we set up a test we could score. We built a synthetic energy trading desk with problems planted in its data, kept the answer key to ourselves, and gave an AI agent the desk head's question in plain words. The agent had two things from us: the QuestDB agent skill and the official QuestDB MCP server. No hints about markouts, no SQL, no list of tables.
This is the exact prompt every run received:
I run an energy trading desk. Our QuestDB instance holds our trading activityand the market data for the last few days.
I want to know how well we executed during yesterday's session, Wednesday 11November 2026. Are we getting picked off, and if so where, by whom, and howbadly? If something looks wrong but isn't really an execution-quality problem,tell me what it is instead.
Leave me a dashboard in the QuestDB Web Console that I can reopen tomorrow, andfinish with a short written summary of what you found, with the evidence foreach point.
Then we checked what it found, what it missed, and what it got wrong, over eight scored runs of Claude Code and Codex. The short version:
- Every run finished the job with no human help. Between 7.5 and 15.4 minutes, 57 to 124 queries, and a dashboard in the QuestDB Web Console at the end.
- The SQL stopped being the problem. Each run had one to four failed queries, and the agent fixed every one of them itself.
- The findings depend on the run. A few problems were found by nearly every run. Problems that need a specific analytical choice were found by some runs and not others.
- Claude Code went deep and Codex went wide. Claude Code dug into execution and counterparties, Codex checked models, marks and limits. Across all their runs, Claude Code found 10 of the 13 planted problems and Codex 8, and together they found all 13. Frontier models sharpened the reasoning but didn't change where each tool looked.
- One follow-up prompt doubled what the agent found. Asking once more to keep digging took both tools from 4 planted problems to 7 or 8, and each went straight to the areas it had skipped.
None of this replaces an analyst. What it does is take an analyst from a blank screen to a documented first pass, with the queries and a dashboard attached, in about ten minutes. That's a very different starting point for the judgment that follows.
How you measure it: markouts #
If you don't spend your days in post-trade analysis, one concept carries most of this post: the markout. For each fill, you look at where the mid price was some time after the trade (one second, one minute, thirty minutes) and sign the move by your side, so positive means the market moved your way.
Aggressive fills, where you cross the spread, should start at about minus half the spread and stay there or recover. Resting fills should start at about plus half the spread and keep it. A curve that keeps falling after the fill is what getting picked off looks like in the data, and post-trade analysts call it adverse selection. Our markout recipe covers the details, and the post-trade analysis overview puts it in context with slippage and implementation shortfall.
Standard SQL has nothing for this. Databases that add an ASOF JOIN get
closer, but an as-of join matches each fill to the quote prevailing at one
moment, and a markout curve needs that quote at many horizons before and after
every fill. You end up repeating the join once per offset, or multiplying every
fill by the list of offsets and pivoting afterwards. In practice an agent
exports trades and quotes, computes the curves in Python, and writes them back
to a markouts table so a dashboard can read them: a pipeline to build, keep in
sync and trust.
In QuestDB, a markout curve is one query. A
HORIZON JOIN pairs every fill with the
prevailing quote at a whole list of offsets in a single pass, and the result
comes back grouped by offset, ready to chart. It's one of the time-series extensions QuestDB
adds to SQL, alongside ASOF JOIN, SAMPLE BY and TICK intervals, so the
agent runs it as a plain statement: no export, no extra code, no results table
to maintain. That's why it shows up in every query the agents wrote below.
The setup: the QuestDB agent skill and MCP server #
The agents ran with the setup we recommend to anyone pointing a coding agent at QuestDB:
- The QuestDB agent skill , installed with
npx skills add questdb/skills. It teaches the agent QuestDB's SQL dialect, the mistakes that standard SQL habits lead to, and how to approach an analysis like this one. - The official QuestDB MCP server ,
which connects the agent to the Web Console. An agent doesn't need it to
query QuestDB:
SHOW CREATE DATABASEreturns the whole schema in one statement, and the REST API, PGWire or QWP run any query. What the MCP server adds is the console itself, so the agent can build notebooks and dashboards you reopen later. It also works through your own console session: on QuestDB Enterprise the agent acts under your SSO login, so you never share credentials or create a service account and token for it. - One pairing click. The MCP server opens a consent prompt in the console. We grantedRead permission: the agent can query data and build notebooks, but can't change any table.
That's the whole setup. Both agents ran headless with the same skill version, the same MCP server version (0.5.0), QuestDB 10.2.0, and nothing else in their context: no project instructions, no hints and no previous runs.
We ran each tool three times with its default model here, Claude Code with Claude Opus 5.5 and Codex with gpt-6.1-sol at medium reasoning effort, and once more with its frontier model: Claude Fable 5.1 and gpt-6-astra. The run we follow step by step below is the gpt-6-astra one.
The data: a synthetic energy desk with planted problems #
The desk trades oil, gas, LNG, power and carbon across ICE, ICE Endex, EEX and CME. Prices follow live front-month levels, and the data covers two and a half days: every top-of-book quote, every exchange fill, a booking log where corrections are new versions rather than overwrites, curve marks, pricing model outputs, position limits and end-of-day positions. In QuestDB that's 12 tables, 5 materialized views, 2 live views and 17 views, with 78.8 million quotes, 5,887 exchange fills and 6,465 events in the booking log.
Hidden in it, as a desk would actually see them:
- Two counterparty types that trade on information in broker and bilateral deals, and others that don't.
- One book that trades with foresight and one that always crosses the spread.
- A venue with wider spreads , and athree-minute outage of its quote feed.
- A sudden 8% repricing of winter gas and power, which moves every markout around it.
- Booking errors: a fill booked at ten times its size, a trade booked twice, and voice deals booked hours late.
- A position-limit breach , amanual curve mark above the market, and apricing model that doesn't adapt to the repricing.
The answer key lived in the database as a table, and we dropped it before any agent connected. We also found two real effects we hadn't planted, which the agents found too: quarterly and seasonal contracts quote so rarely that their quotes are often stale, and two back-month gasoil contracts drift against the desk on one of the days.
We scored each run on four things:
- Completion: did it get from schema to dashboard?
- Correctness: which planted problems did it find, which did it miss, and did it claim anything the data doesn't support?
- Interventions: how often did a human have to step in?
- Setup effort: what did it take before the agent could start?
One run, step by step: Codex with gpt-6-astra #
The run we'll follow is Codex on gpt-6-astra, the best single run in the test: eight of the thirteen planted problems, and a headline that held up. It took 9.7 minutes, 80 queries and 20 query validations.
It didn't start with markouts. Its first dozen queries profiled every table,
read the lineage view, and looked at the limits, the booking statuses, the
pricing model versions and who had marked the curves. It read the definitions
of the views it planned to use with SHOW CREATE VIEW. Only then did it say
what it was going to do:
I'm checking these separately so booking corrections or valuation issues do not get mistaken for poor execution.
Two problems turned up before it had computed a single markout. A quarterly TTF mark had been set by hand €2.50/MWh above the months it's made of, for 30 minutes. And the production pricing model was far off on winter gas and power. It then split the model's error at the moment of the repricing:
DECLARE @day := '2026-11-11T00:00:00Z'::timestampSELECT model_version, curve, CASE WHEN ts < '2026-11-11T09:30:00Z' THEN 'before 09:30' ELSE 'after 09:30' END AS phase, count() AS n, avg(err_bps) AS bias_bps, avg(abs(err_bps)) AS mae_bpsFROM energy_model_graded_dayWHERE season = 'winter'GROUP BY model_version, curve, phaseORDER BY curve, phase, model_version;
Before 09:30 both models were within a fraction of a basis point. After it,
the production model was 360 to 430 bps below the market on winter NBP, TTF
and UK power, while the challenger model, which refits every hour, was off by
about 10. The energy_model_graded_day view it queried takes the day as a
parameter, and the agent set it with a DECLARE.
It found the feed outage with a query at the right resolution. Ten-second buckets, with the empty ones filled with zero, show the three minutes with no EEX quotes at all:
SELECT ts, source, count() AS ticksFROM energy_quotesWHERE ts IN '2026-11-11T08:44;5m' AND source = 'EEX'SAMPLE BY 10s FROM '2026-11-11T08:44:00' TO '2026-11-11T08:49:00' FILL(0);
About 800 ticks every ten seconds, then zero from 08:45:00 to 08:47:50, then 800 again. A follow-up query confirmed no EEX fills fell inside the gap, so it reported it as a market-data problem rather than an execution one.
For the position limit it rebuilt the Brent position through the day from the start-of-day snapshot and the booking log, with a running sum:
WITH final_book AS ( SELECT * FROM energy_trade_events WHERE booked_ts <= '2026-11-12T09:20:00Z' LATEST ON booked_ts PARTITION BY trade_id), changes AS ( SELECT ts, book, curve, qty FROM energy_position_snapshots WHERE ts IN '2026-11-11' UNION ALL SELECT trade_ts AS ts, book, curve, qty FROM final_book WHERE trade_ts IN '2026-11-11' AND status != 'CANCELLED'), net AS ( SELECT ts, book, curve, sum(qty) AS dq FROM changes GROUP BY ts, book, curve), running AS ( SELECT ts, book, curve, sum(dq) OVER (PARTITION BY book, curve ORDER BY ts CUMULATIVE) AS position FROM net), peaks AS ( SELECT book, curve, max(abs(position)) AS max_abs_position, arg_max(ts, abs(position)) AS peak_ts FROM running GROUP BY book, curve)SELECT p.book, p.curve, p.peak_ts, p.max_abs_position, l.max_abs_qty AS recorded_limit, l.unit, p.max_abs_position / l.max_abs_qty * 100 AS utilisation_pctFROM peaks pJOIN energy_limits l ON p.book = l.book AND p.curve = l.curveORDER BY utilisation_pct DESC;
The crude book peaked at 2.93 million barrels at 07:29 against a 2 million limit, 147% of it. No Claude Code run on Opus checked the limits at all.
Then came execution. Gasoil's aggressive fills cost 1.51 bps at the fill against a 1.48 bps half-spread, so it called that the cost of crossing, not adverse selection. The NBP losses were concentrated in the hour of the repricing, and split cleanly by side: sells between 09:00 and 10:00 lost 283 bps at 30 minutes and buys gained 300, which is a market move, not someone trading against stale prices.
Broker and bilateral deals carry the counterparty's name, so that's where it looked for who. Its first attempt failed, and so did its second:
unsupported HORIZON join expression[expr='q.source = case when t.curve in ('TTF', 'EUA') then 'ICE_ENDEX' ... end']
Voice deals have no venue of their own, so the agent wanted each one marked
against the primary venue for its contract, and tried to pick that venue
inside the join condition. HORIZON JOIN doesn't accept an expression there.
On the third attempt it moved the CASE into the left side as a column, and
joined on that. This is the start of the query it ended up with:
WITH deals AS (( SELECT *, CASE WHEN curve IN ('TTF', 'EUA') THEN 'ICE_ENDEX' WHEN curve = 'WTI' THEN 'CME' ELSE 'ICE' END AS quote_source FROM energy_trade_events WHERE version = 1 AND channel != 'EXCH' AND trade_ts IN '2026-11-11' ORDER BY trade_ts) timestamp(trade_ts)),marks AS ( SELECT t.trade_ts AS ts, t.trade_id, h.offset / 1000000.0 AS horizon_s, q.ts AS quote_ts, (q.bid + q.ask) / 2 AS mid_px, (q.ask - q.bid) / 2 AS half_spread FROM deals t HORIZON JOIN energy_quotes q ON (t.symbol = q.symbol AND q.source = t.quote_source) LIST (-30s, 0, 1s, 30s, 5m, 30m, 1h) AS h)...
The timestamp(trade_ts) gives the filtered deals a designated timestamp so
they can sit on the left of the HORIZON JOIN. The rest of the query joins
each mark back to the latest version of its booking, drops quotes older than
30 seconds, and signs the markout by side.
Its headline came from there: utility counterparties in oil voice deals. 32 trades with fresh quotes lost $81,235 at five minutes, $55,868 of it after the trade. It checked that against two baselines before blaming anyone. It compared each deal with exchange fills in the same contract, on the same side, within the hour, and the utility deals came out 6.98 bps worse (t = -3.10). And it repeated the analysis for the previous day, where utilities were negative again but not significant on their own. It reported the result as grounds for review, not proof.
That was right about utilities, and it undersold industrials. Its own chart, panel 02 above, has the industrial line falling furthest by one hour, but its statistical tests stopped at five minutes, where industrials looked weaker, so it listed them as a watch item.
The rest of its report covered four volatility marks corrected by eight points, the EEX feed gap, and 34 trades booked the next day. It left a notebook with 20 panels, each with its SQL and the trade IDs behind it, and fixed its dates to the session so the review stays as it was.
What it missed: the crude book's edge, which shows as the two rising lines in its own exchange markout chart, the stale strip quotes, the duplicate ticket, the 10x booking and the cost of routing aggressive orders to EEX.
The scorecard: three Claude Code runs #
The Claude Code runs on Opus went deep where Codex went wide. Run 1 is the best example. It grouped broker and bilateral deals by counterparty type, derived from the name prefix, and when one day was too thin to call, it widened to every day in the database and checked whether the effect held on each:
DECLARE @hist := '2026-11-[10..12]'WITH f AS (( SELECT trade_ts, left(counterparty, length(counterparty) - 3) AS cp_type, timestamp_floor('d', trade_ts) AS trade_day, symbol, qty, px, CASE WHEN curve IN ('TTF', 'EUA') THEN 'ICE_ENDEX' WHEN curve = 'WTI' THEN 'CME' ELSE 'ICE' END AS src FROM (energy_trade_events WHERE booked_ts IN @hist LATEST ON booked_ts PARTITION BY trade_id) WHERE channel != 'EXCH' AND status != 'CANCELLED' AND trade_ts IN @hist ORDER BY trade_ts) timestamp(trade_ts)),m AS ( SELECT t.cp_type, t.trade_day, h.offset / 1000000 AS horizon_sec, count() AS n, avg(sign(t.qty) * ((q.bid + q.ask) / 2 - t.px) / t.px * 10000) AS mo, stddev_samp(sign(t.qty) * ((q.bid + q.ask) / 2 - t.px) / t.px * 10000) AS sd FROM f t HORIZON JOIN energy_quotes q ON (t.symbol = q.symbol AND t.src = q.source) LIST (300s, 1800s) AS h)SELECT cp_type AS counterparty_type, trade_day, n AS trades, round(max(CASE WHEN horizon_sec = 300 THEN mo END), 2) AS markout_5m_bps, round(max(CASE WHEN horizon_sec = 1800 THEN mo END), 2) AS markout_30m_bps, round(max(CASE WHEN horizon_sec = 1800 THEN mo / (sd / sqrt(n)) END), 1) AS t_30mFROM mGROUP BY cp_type, trade_day, nORDER BY counterparty_type, trade_day;
Industrial counterparties came out at -9.5 bps at 30 minutes over 114 trades, with t = -3.8, and negative on every day. Utilities were weaker but also significant. Banks, trading houses and producers were fine. That's the planted effect, found with the right evidence, and it's the finding the Codex runs only got halfway to.
The same run measured the age of the quote behind every fill, by contract tenor. The median was 0.03 seconds for monthly contracts, 9.3 for quarters and 16 for seasons, so the "slippage" on strips was a stale benchmark, not a bad fill. Every Claude Code run found that, and no Codex run did. Run 1 also flagged the crude book as "too good", +7 to +9 bps at 15 minutes for every trader on every day, and suggested checking the fill timestamps before crediting skill. That's the right caution for a planted foresight effect, and the only run of any agent that called it out.
| Planted or real effect | Run 1 | Run 2 | Run 3 |
|---|---|---|---|
| Market-wide repricing, not execution | ✅ | ✅ | ✅ |
| Stale strip quotes | ✅ | ✅ | ✅ |
| Duplicate and late bookings | ✅ | ✅ | ✅ |
| 10x booking error | ✅ | partly | ✅ |
| Informed counterparty types | ✅ | ❌ | ✅ |
| Crude book trades with foresight | ✅ | ❌ | ❌ |
| Position-limit breach | ❌ | ✅ | ❌ |
| EEX feed outage | ❌ | ❌ | ✅ |
| EEX costs more for aggressive orders | partly | ❌ | ✅ |
| Gasoil pays the spread | ❌ | ❌ | ❌ |
| Manual curve mark | ❌ | ❌ | ❌ |
| Explanations that the data contradicts | 0 | 1 | 0 |
| Run 1 | Run 2 | Run 3 | |
|---|---|---|---|
| Time | 11.4 min | 10.7 min | 9.8 min |
| Queries | 61 | 71 | 57 |
| Failed queries, fixed by the agent | 2 | 1 | 2 |
| Human interventions | 0 | 0 | 0 |
The one wrong explanation came from run 2. It found the limit breach, which no other Claude run did, then used it to explain the crude book's gains as the desk's own price impact. The gains are the same on days without a breach, so that explanation doesn't hold. The finding was right and the story built on it wasn't.
Codex: same skill, same prompt, different instincts #
The Codex runs validated queries before running them, with 21 to 35
validate_query calls each, so most syntax errors were caught before
execution. That's the "validate every statement" step in the skill's dashboard
checklist, which the Claude runs mostly skipped.
They also went wide where the Claude runs went deep. Every Codex run checked the pricing models and the curve marks, and every one found two planted problems no Claude run reached: the production pricing model undervaluing winter gas and power, by 240 to 290 bps averaged over the day, and thirty manual marks exactly €2.50 above the market. Run 3 went further, finding the position-limit breach, the feed outage and a bad volatility mark as well. Two of the three read gasoil's cost correctly, as the half-spread and nothing more, which no Claude Code run on Opus did.
In exchange, the Codex runs went less deep on execution: no counterparty segments, no stale strips and none of the booking errors beyond late tickets. They named individual counterparties on a watchlist instead, with a caveat about sample size.
Codex also tended to lead with the most extreme slice it found. Run 2's headline was WTI broker flow, down 6.16 bps at five minutes over 24 trades. The numbers are right, but every counterparty type in that slice was negative that day, including the banks that are on the desk's side across the whole dataset. It's a price move on a small sample, not adverse selection, and checking the same slice on the other days would have shown it. Run 3 led with five WTI trades from producers, a counterparty type that does nothing special in this data. Both came with a caveat about sample size, but both were the first thing a reader would see.
One smaller difference: Codex read "a dashboard I can reopen tomorrow" as "keep this review", and fixed the dates, while every Claude run added a date variable to rerun the dashboard for another session. The prompt allows both.
| Planted or real effect | Run 1 | Run 2 | Run 3 |
|---|---|---|---|
| Pricing model doesn't adapt | ✅ | ✅ | ✅ |
| Manual curve mark | ✅ | ✅ | ✅ |
| Late bookings | ✅ | ✅ | ✅ |
| Market-wide repricing, not execution | ✅ | ✅ | partly |
| Gasoil pays the spread | ❌ | ✅ | ✅ |
| Position-limit breach | ❌ | ❌ | ✅ |
| EEX feed outage | ❌ | ❌ | ✅ |
| Bad volatility mark | ❌ | ❌ | ✅ |
| Informed counterparty types | partly | partly | partly |
| Crude book trades with foresight | ❌ | ❌ | ❌ |
| Stale strip quotes, 10x booking, duplicate | ❌ | ❌ | ❌ |
| Headlines that the data doesn't support | 0 | 1 | 1 |
| Run 1 | Run 2 | Run 3 | |
|---|---|---|---|
| Time | 7.5 min | 9.7 min | 14.9 min |
| Queries, plus validations | 60 + 21 | 98 + 23 | 124 + 35 |
| Failed queries, fixed by the agent | 1 | 2 | 2 |
| Human interventions | 0 | 0 | 0 |
What the agents found reliably, and what they didn't #
The results split into three groups:
- Found by nearly every run: the market-wide repricing and the late bookings, both visible in one table with a clear signature.
- Found by one tool every time and by the other never: stale strip quotes for Claude Code; the pricing model and the manual mark for Codex.
- Found sometimes: anything that needs a specific analytical choice. Grouping counterparties by a type that isn't a column, checking one book across days, rebuilding a position against a limit, scanning for gaps in a feed. Each run takes some of these paths and not others, and which ones looks close to random.
Two consequences follow. A single run reads as complete even when it isn't: every summary was confident and well argued, including the ones that missed the main finding. And because different runs and different agents look in different places, two or three runs combined cover far more than any one run.
Asking once more: what a follow-up prompt adds #
Every result so far came from a single prompt. To see what one more message does, we took the Claude Code run and the Codex run that had each found 4 of the 13 planted problems, and continued each one from exactly where it had stopped, with one of two follow-ups:
- Keep digging: "Keep digging. Is there anything else in the data I should know about? Add anything new to the dashboard and update your summary."
- Coverage list: "Before you finish: list every table and view in the database and what you checked in each. Then investigate anything you haven't checked yet, add what you find to the dashboard, and give me a revised summary that ends with that coverage list."
| Planted problems found | First answer | + keep digging | + coverage list |
|---|---|---|---|
| Claude Code (Opus 5.5) | 4 | 8 | 7 |
| Codex (gpt-6.1-sol) | 4 | 8 | 7 |
Each second pass took between 9 and 15 minutes, and each tool went straight to its own blind spots. Claude Code found the pricing model, the manual mark, the volatility mark and, with "keep digging", the feed outage. Codex found the limit breach, the feed outage, the volatility mark and, with "keep digging", the extra cost of routing aggressive orders to EEX. The second passes also turned up real problems we hadn't planted: start-of-day positions built on booking date, so late tickets put positions on the wrong day, and currency views that quietly fall back to a rate of 1.0 when FX quotes are missing.
The wording mattered less than asking at all, and neither follow-up fixed the hard cases. No second pass found the informed counterparty types or the crude book's edge, and Claude Code repeated its wrong "price impact" explanation for crude both times.
The coverage list cuts both ways. It makes the work auditable: Codex's list covered all 36 tables and views, with reconciliations such as rebuilding the minute bars from the raw quotes. But it can also turn a weak check into a confident negative. Claude Code's list said "gaps per hour: no gaps" for the quotes, a check too coarse to see a three-minute outage. Because it's written down, a reviewer can spot that, and without the list the same miss would be invisible.
This was two runs and two prompts each, so treat the numbers as an indication rather than a rate. The practical advice holds anyway: before you trust an agent's first answer, ask it once more, and ask for the list of what it checked.
Frontier models #
The frontier runs, Claude Code with Claude Fable 5.1 and Codex with gpt-6-astra (the run we followed step by step), used the same skill as the others, and Astra the same medium reasoning effort as the other Codex runs.
Neither changed where its tool looked. Fable went deep on execution like the Opus runs and found the counterparty types, the feed outage, gasoil's spread cost and the stale strips, but not the models, marks or limits. Astra went wide like the other Codex runs and found eight of the thirteen planted problems, the best single run in the test, but only half of the counterparty finding and neither the duplicate nor the 10x booking.
What changed was the quality of the reasoning. Fable noticed that every fill on the secondary venue had a quote exactly one nanosecond earlier at the fill price, so short markouts there say nothing, which no other run spotted. It also separated the desk's position from its execution: the desk started the day long gas and gained on the repricing, so the loss it reported was the cost of how the selling was done, not the result of the position. Astra led with a real effect, utility counterparties in oil voice flow, and was the only Codex run whose headline held up.
Frontier models weren't immune to overreach, though. Fable called a UK power cost "persistent" when it was confined to the afternoon after the repricing on a single day. A stronger model makes fewer of these, not none.
What agent-ready means: auditable, reproducible analysis #
From these runs, an agent-ready database is one where:
- The agent can find its way around unaided. It profiled the schema, understood a bitemporal booking log and picked the right tables without being told what they were.
- The hard part fits in one query. Markouts at a list of horizons, per
fill, against the matching venue, is a single
HORIZON JOIN, so the agent spends its time on the analysis rather than on joins. - Errors point to the fix. Every failed query in the scored runs was fixed by the agent itself, nearly always on the next attempt.
- The analysis is reproducible. Each run left a dashboard in the Web Console with the SQL behind every panel, so someone else can open it, rerun it on the same data and get the same numbers.
What it doesn't mean is that the agent's judgment is consistent. The SQL is a solved problem in our tests. Deciding what to look at isn't, yet, and that's where a skill can keep improving and where running more than one agent pays off.
So the agent doesn't replace the analyst. It doesn't know which findings matter to this desk, it can't tell when a confident summary has skipped something important, and both tools built wrong headlines on correct numbers: Claude Code's crude "price impact", and Codex's WTI broker flow and WTI producers. An analyst catches all of that. What the agent does is the part that takes the time: finding the tables, writing the joins, ruling out the obvious, and leaving every result in a notebook where the analyst can check the query behind it. Every finding in these runs came with its SQL, which makes the analysis auditable: each one can be checked by rerunning a query rather than by redoing the analysis. That's how we caught the wrong headlines.
Auditable also means you can see what the agent ran. Through MCP it queries
under your own login, so in QuestDB Enterprise its queries are attributed to you
like any other, while open source attributes every query to the admin user.
With query tracing
enabled, every query lands in _query_trace with its text, duration and
principal, so you can review an agent's whole session in SQL. Tracing is off by
default and keeps 24 hours, which makes it a tool for reviewing recent sessions
rather than a long-term audit log.
For a regulated desk, that attribution matters: every query an agent ran traces back to the person who paired it, and the agent can only read what that person is allowed to read. Start a QuestDB Enterprise trial to run the same setup under your own SSO login.
To set up your own agent the same way:
- The QuestDB agent skill , and theAI coding agents guide for installing it
- The QuestDB MCP server , for Web Console notebooks and dashboards built under your own login
- Transaction cost analysis with QuestDB and Polars , if you'd rather write the analysis yourself