What is this #
A reading of the Agentic Coding in the Wild paper, the first production-scale measurement of an AI coding agent, by researchers at Microsoft Azure Research and UIUC. The findings are theirs. I have just tried to bring out the parts I found most interesting and lay them out in a way that is easy to digest.
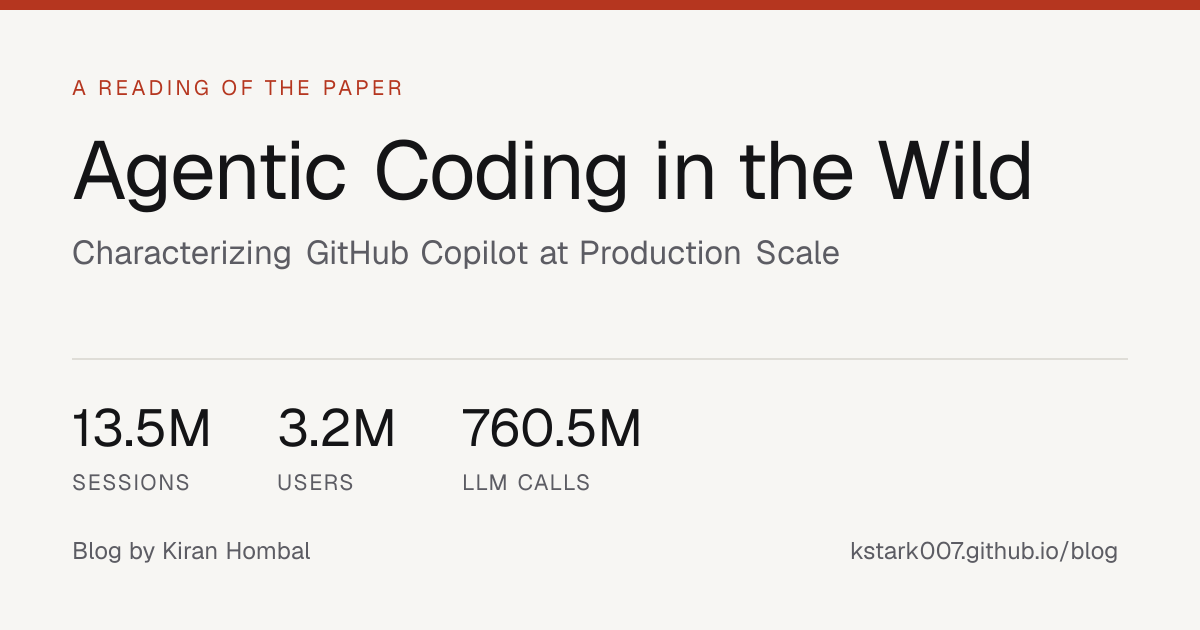
Anonymized telemetry from GitHub Copilot’s coding agent in Visual Studio and VS Code, covering one week. Structural metadata only: timings, token counts excluding reasoning tokens, model and tool names, success and failure. No prompts, no code, no user identity. The authors analyse a sampled subset of the traces except where they compute aggregate metrics, and the sample is drawn from US regions spanning at most three timezones.
- Sessions
- 13.5M
- User turns
- 95.1M
- Users
- 3.2M
- LLM calls
- 760.5M
- Tool calls
- 774.7M
- Prompt tokens
- 44.9T
- Completion tokens
- 39.3B
- Models / tools
- 27+ / 45+
Table 3 · Sampled traces, first week of june 2026
A coding agent is not a chatbot with tools #
Serving systems like vLLM and SGLang were built for a workload of independent, short-lived, stateless requests. Scheduling, admission control and cache management all happen at the granularity of a single request.
Agentic coding violates that model on almost every axis. One user message expands into a turn of 4.5 model calls at the median; the median session runs 15 across three turns. Later actions often depend on the exact output of previous tool executions, execution alternates between GPU and CPU work, and within a turn the prompt prefix grows monotonically as history accumulates.
-
Calls per interaction
-
115 median, 40+ mean
-
Token asymmetry
-
ModerateExtreme: 68K prompt, 247 output
-
State between calls
-
Stateless, replayedTight sequential dependency
-
Resource pattern
-
GPU onlyGPU and CPU/IO alternation
-
Session duration
-
SecondsSeconds to minutes or hours
-
Failure handling
-
Manual retryRetry loops, 48x P95 blowup
-
Cache sensitivity
-
Low, requests independentHigh, prefix-sharing in the loop
-
Autonomy level
-
User-drivenAgent-driven, 87% of LLM calls Table 2
The loop runs itself #
Every turn begins with exactly one user-initiated call. Everything after it is the agent deciding, on its own, to keep going.
Across the whole population the ratio of LLM calls to tool invocations sits at almost exactly 1:1, and it holds across the whole distribution rather than only on average, with one exception the authors name: the 20.2% of turns that call no tools at all. Most model calls end in an action; most actions immediately provoke another model call. Reasoning without action and action without reasoning are both rare.
Takeaway 1
The agentic loop enforces a strict 1:1 coupling. Serving systems must treat an LLM call and its tool invocation as an inter-dependent pair, not two independent requests.
After a user message the agent runs a mean of 6.6 LLM calls before handing control back. That makes 87% of all LLM calls agent-initiated rather than user-initiated, so most serving load originates from autonomous execution rather than from a person pressing enter, and the distribution is skewed: a small fraction of requests trigger long chains that account for a disproportionate share of the load.
Takeaway 2
87% of LLM calls are agent-initiated. User request arrivals alone do not predict LLM load, so capacity planning needs session- or turn-level modeling of the autonomous chains.
Execution is also stubbornly serial. 63.3% of all turns show some overlap, but the median concurrency is only 1.15 and P90 reaches 1.4. Concurrency appears in the middle of a turn, during exploration, then collapses back to one as the agent converges on a decision that depends on every preceding branch.
Takeaway 3
Agentic execution is predominantly serial. Concurrency stays shallow and sits in the middle of a turn, creating occasional straggler dependencies and KV-cache contention between two or three calls of the same session.
The median session is nothing like the mean one #
Half of all sessions finish in 4.2 minutes with three turns and fifteen model calls. The average session runs 62.6 minutes. That is a mean-to-median ratio of 14.9x: a small fraction of long-running sessions accounts for a disproportionate share of all coding-agent activity, and at P90 a session is still going after nearly three hours.
The paper’s conclusion from this spread is that serving systems have to reason about workflow progress rather than treat every turn as a homogeneous request.
Weekend sessions are fewer, but heavier
Per-session prompt tokens rise from roughly 1.2M to 1.7M on weekdays to 1.9M to 2.4M at the weekend. Fewer sessions, but more ambitious ones, which reads as developers attempting larger work when nobody is interrupting them.
Chat workloads show the opposite pattern, where the longer sessions fall on weekdays.
Even the shape of a turn is skewed. The median turn triggers 4.5 model calls, but at P90 it takes 15.9 calls, 21 tool invocations and over a million prompt tokens. A minority of complex turns dominates both execution time and token consumption.
Six shapes of a turn #
Each turn is a workflow generated on the spot from the task in front of it. Clustering them by tool composition, call depth and token consumption produces six recurring shapes.
The largest group is exploration: 30.5% of turns are repeated file retrieval, symbol lookup and repository navigation, gathering context before touching anything. At the other end, 20.2% of turns call no tools at all and are pure reasoning.
Between them sits the ordinary engineering loop: read, modify, build, read the errors, modify again.
9.1% of turns
Failure is not an error path. It is a workload.
A turn that hits a failed build or a missing dependency often triggers additional reasoning, retries and tool invocations, and the context window can grow with accumulated error output as it goes into the prompt.
- LLM calls
- 36against a per-turn median of 4.5
- Compute
- up to 4xamplification, as the paper states it
Takeaway 4
Coding-agent workflows are highly heterogeneous, and iterative retry workflows can amplify compute by up to four times. Scheduling has to reason about workflow progress, not treat every turn as an equivalent request.
>275:1 #
The median call sends 68K prompt tokens and receives 247 back. 88% of calls produce under a thousand output tokens. For comparison, production chat traces report a median prompt of 750 tokens and a median completion of 105.
This is not a generation workload wearing a different hat. The cost is almost entirely on the input side, which is why the paper calls KV-cache reuse the critical serving lever.
Takeaway 5
Coding-agent workloads are far more token-intensive than chat traces, and a large share, 28%, of prompt tokens originates from tool-call results.
Takeaway 6
Agentic sessions are overwhelmingly LLM-bound, but time and token contributions are inverted. Inference takes 85.4% of wall-clock time yet contributes 48% of prompt tokens; tools take 4.7% of the time yet contribute 28% of the tokens.
Time and tokens point opposite ways
Inference owns the clock but contributes 48% of prompt tokens. Tools take 4.7% of the time yet inject 28%. The paper’s reading: model-latency work helps almost every session, while tool-system work only helps the minority dominated by long-running commands.
LLM execution
Tool execution
Shares of non-idle wall-clock time, from Takeaway 6. Counting the whole session, the median multi-turn session is 80.1% user idle, and the median inference share is 13.7%.
The cache is not a request property. #
It is a session property.
Prefix caching is a critical serving lever in this workload, and its lifecycle is governed by session structure rather than by anything the serving system can see in a request.
Inside a turn, prefix caching works almost perfectly. Each call extends the prompt by a small amount and preserves everything before it, so the median call arrives with 63K of its 68K prompt tokens already cached. Across all calls the median hit rate is 98%.
That number hides a bimodal distribution. Roughly 10% of calls see low reuse, below a 20% hit rate, reflecting cold-start calls with minimal prefix to reuse. The paper identifies three structural events that produce those cold starts, none of which a request-scoped scheduler can anticipate.
Takeaway 7
Prefix caching is high overall, a median of 98%, and follows a predictable trajectory within a turn: 45% on the cold-start call, 86% by the second, and a 92 to 94% plateau from the third onward.
One. The turn boundary
When a turn ends, the user goes away to read, think, or do something else. The gap that follows is long relative to the seconds between calls inside a turn, and the shape of the data is the signature of a time-based eviction policy at the serving system: the entry is likely gone before the next turn arrives. The first call of the next turn lands on a cache that is 26 points colder.
Takeaway 8
Turn boundaries degrade absolute cache hit rates by 26 points on average, primarily through time-based eviction during inter-turn idle periods.
Two. The model switch
A KV cache built for one model’s weights cannot be read by another, so a switch does not degrade the cache, it deletes it. Switches touch 6.4% of sessions and are mostly reactive: the non-success rate before a switch is 36% against an 8% baseline, so they are usually a response to errors or rate limiting.
The first call after a switch averages an 8% hit rate. That is a cold start, paid on top of the eviction loss the boundary already caused.
Takeaway 9
Model switches are mostly reactive to rate limiting and compound a turn boundary into near-total cache loss. Pinning sessions to one model, and staging the target model’s cache before an unavoidable switch, are the available defences.
None of this is visible from inside a single request. Scheduling, admission control and cache management are typically performed at the granularity of individual requests rather than workflows.
That is the argument for making the KV cache a session-aware schedulable resource rather than a per-request optimization, and it is what the idle-time section turns into something predictable.
The third reset is self-inflicted #
A long session eventually pushes its prompt toward the model’s context limit. The agent responds by compacting: it rewrites the prompt, summarizing or dropping older messages to buy room to continue.
That rewrite lands on the prefix. The rewritten prompt shares little prefix with what came before, so the cache resets as thoroughly as it would on a model switch, except this time the serving system did it to itself while managing its own context window.
Takeaway 10
Compaction affects 7.8% of sessions, typically dropping prompt tokens by over 70% and cache hit rate by 67%. Incremental, prefix-preserving compaction could keep part of the cache alive.
Compaction concentrates in the heaviest sessions. The 7.8% of sessions that compact at least once account for:
- of all sessions
- 7.8%
- of all tokens
- 44.2%
- of all LLM calls
- 37.1%
- of all tool calls
- 38.9%
Table 6
The sequence is the problem. A session explores deeply, fills its context window, triggers compaction, loses nearly all cached state, and then rebuilds it from scratch, paying both higher latency and higher cost at precisely the moment the task has become most complex. Among long-context sessions, those with prompts over 100K tokens, the rate rises to 22.6%.
The other half of the loop #
More than forty tools are available. Eleven of them account for over ninety percent of all invocations, and the ones that fail most are not the ones that fail cheapest.
Failures are generally slower, and failed builds are the clearest context-expensive exception
-
success rate for run_command, run_build and edit_file, against close to 100% for reads and searches
-
73%
-
longer at P95 for a failed run_command_in_terminal than a successful one
-
48x
-
more prompt tokens injected by a failed build than a successful one, which returns a median of about 60
-
7-8x Takeaway 11
Tool usage is concentrated and heterogeneous. Read-heavy tools complete fast and succeed nearly universally, while execution tools dominate the tail and fail more often, extending dependency chains and the time a session holds its resources.
Agents batch tools, but barely
93% of tool batches contain a single invocation. Among the rest the median width is 2 and 87.5% hold at most three, though the tail reaches 108 concurrent calls.
Parallelism is concentrated in read-only operations. Writes and terminal commands mutate shared state, so they are rarely parallelized. Since information gathering fills so much of a turn, there is room to batch more reads at no consistency risk.
Takeaway 12
Tool execution is more parallel than LLM execution but remains largely sequential: 93% of batches invoke a single tool, and most parallel batches contain only two or three read-only operations.
How much tool time hides behind inference
Figure 28
- <50ms99%21% of batches
- 50-500ms100%46% of batches
- 0.5-5s76%23% of batches
- 5-30s35%8% of batches
- 30s+5%3% of batches
Short batches are almost entirely shadowed by an active LLM call. Batches over thirty seconds are almost entirely exposed.
By count, overlap looks like a solved problem: 97% of tool batches run at least partly inside an inference window.
By wall-clock time it hides 7.7%. The remaining 92% sits on the critical path, because the handful of long builds and terminal commands that dominate total tool time are precisely the ones nothing is running alongside.
Takeaway 13
Tool and LLM overlap is pervasive by count but hides only 7.7% of aggregate tool wall-clock time. The long tail of long-running tools dominates total tool time, is largely un-overlapped, and drives the latency users actually feel.
Five kinds of developer #
Linking sessions through anonymized user identifiers splits the developer population into five behavioural groups. Readers are the largest group, deep-loop users the most resource-intensive, and chat-only users the lightest.
Readers
203K 41.7% of users · 6 turns per user · 4.8 tools/turn
Exploring unfamiliar codebases, looking up API signatures, gathering context before deciding. Fast, stateless, cheap to cold-start.
203K
Coders
417K 30.4% of users · 50 turns per user · 6.2 tools/turn
The most engaged group by session volume. The full engineering loop: gather context, modify code, validate via build or test.
417K
Terminal users
213K 11% of users · 7 turns per user · 4 tools/turn
Command latency swings from near-instant to minutes-long builds, creating unpredictable idle patterns that complicate scheduling.
213K
Deep-loop users
1.1M 9.2% of users · 6 turns per user · 20 tools/turn
Large refactors, cross-file migrations, long debugging runs. Few sessions, but each turn generates substantial serving load.
1.1M
Chat-only users
23K 7.6% of users · 2 turns per user · 0 tools/turn
The lightest workload on the platform, closer to a traditional chatbot interaction than to an agentic coding workflow.
23K The cost of a cache miss varies by more than an order of magnitude across these groups. For a deep-loop user, one eviction means re-prefilling a median 1.1M tokens. The identical event for a chat-only user costs 23K.
A uniform eviction timeout therefore imposes a disproportionate latency tax on the most resource-intensive user segments. Container lifecycle has the same asymmetry: coders and terminal users accumulate real state, modified files, running processes and build artifacts, while readers can be cold-started with negligible overhead.
Takeaway 14
User archetypes span a 50x range in per-turn token consumption, making uniform resource policies suboptimal. Archetype-aware SLOs can cut tail latency for power users while freeing memory in aggregate.
Idle time is bimodal, and that is the opportunity #
The loop alternates between GPU-bound inference and CPU-bound tool execution, so both resources spend time allocated and unused. The gaps come in two sizes, and only one of them is worth acting on.
Idle duration, inside a turn against across a boundary
Table 8 Container
Elapsed time between two consecutive tool invocations.
5.8s
P95 44s
4.1min
P95 90min
KV cache
Elapsed time between two consecutive LLM calls.
1.2s
P95 37s
2.9min
P95 75min
Over 90% of idle intervals are intra-turn and last seconds, too short to pay back the cost of reclaiming anything. The 8 to 9% that cross a turn boundary last two orders of magnitude longer.
A turn boundary says a session may be reclaimable. It does not say for how long.
Reclaim too early and the next turn pays a reload. Reclaim too late and the memory sits idle. So the authors train a small model that, at each boundary, emits a survival curve: the probability the session stays idle longer than t.
That shape lets an operator choose an operating point without retraining, and refine it for free as time passes, since the conditional probability is just a ratio of two points on the same curve.
- Model
- 12 LightGBM quantile regressors
- Size
- ~2 MB
- Inference
- <3 ms per boundary
- ROC-AUC at 60s
- 0.73, against 0.58 for a previous-gap heuristic and 0.5 for always-positive
What the model leans on
- Avg idle time so far28.7
- Turn index25.6
- Prev. idle time11.5
- LLM success rate10.7
- Turn duration8.5
- LLM calls7.6
Figure 33a · top 6 of 11 · session-level features in accent
Takeaway 15
Intra-turn idle periods are short and occur during autonomous execution. Cross-turn idle periods are minutes long because a human stepped away. Turn boundaries are therefore the natural trigger for container hibernation and KV-cache off.
The prediction is actionable even without control of the backend. Cache retention is time-bounded, five minutes by default on Claude models, so a session idling past that window is recomputed regardless of when its next turn actually arrives. When the predictor says the idle gap will straddle that cutoff, a provider can issue one cheap keep-alive just before the deadline and skip the full recompute entirely.
What changes downstream #
These findings challenge the assumptions underneath current LLM-serving systems. The paper’s answer is agent-native infrastructure: a scheduler that knows which session a request belongs to, and where in that session it sits.
- Retention priority§8.3
- Deep-loop and coder sessions should receive higher KV-cache retention priority. A single miss costs a deep-loop user a median 1.1M token re-prefill, against 23K for a chat-only user.
- Eviction and container lifecycle§8.3
- Chat-only and reader sessions can be evicted after short idle timeouts with no meaningful latency penalty. Terminal and coder users hold real container state and need checkpointing rather than termination.
- Capacity planning§8.3
- Per-user fair-share policies must account for the 50x token gap between chat-only and deep-loop users, to avoid both starving intensive users and over-provisioning for light ones.
- Session-to-model pinning§5.4
- Pinning a session to one model preserves cache continuity. When a switch is unavoidable, stage the target model's cache in advance rather than paying a synchronous cold start.
- Incremental compaction§6
- Compaction rewrites the prefix and resets the cache as severely as a model switch. Prefix-preserving or overlapped compaction could maintain partial cache continuity.
- Turn-boundary reclamation§9.3
- Within a turn, keep the cache resident and the container warm. At a turn boundary, a predicted idle window is long enough to amortize off and hibernation.
Fifteen takeaways #
Every finding the authors chose to number, with the section of this page that shows the evidence.
- 01The agentic loop enforces a strict 1:1 LLM-to-tool coupling. Serving systems must treat LLM calls and their corresponding tool invocations as an inter-dependent pair, not independent requests. §4.3
- 0287% of LLM calls are agent-initiated. User request arrivals alone do not predict LLM load; capacity planning requires session- or turn-level modeling of autonomous agent execution chains. §4.3
- 03Agentic execution is predominantly serial. While 63% of multi-call turns exhibit some overlap, concurrency remains shallow (P90 = 1.4) and is concentrated in the middle of turns, creating occasional straggler dependencies and same-session KV-cache contention. §4.3
- 04Coding-agent workflows are highly heterogeneous, producing large variation in LLM and tool calls and in token consumption. Iterative retry workflows can amplify compute by up to 4x, making workflow-aware scheduling important for efficient serving. §4.4
- 05Coding-agent workloads are highly token-intensive: both prompt and completion lengths are substantially larger than those in text-only and multimodal chatbot API traces. A large share, 28%, of prompt tokens originates from tool-call results. §5.1
- 06Agentic sessions are overwhelmingly LLM-bound, but time and token contributions are inverted. LLM execution takes 85.4% of wall-clock time yet contributes 48% of prompt tokens, whereas tool calls take only 4.7% of time yet contribute 28% of tokens. §5.1
- 07Prefix caching is high overall, a median of 98%, and follows a predictable trajectory within a turn: 45% on the cold-start call, jumping to 86% by the second call, and plateauing at 92 to 94% from the third call onward. §5.2
- 08Turn boundaries degrade absolute cache hit rates by 26 points on average, primarily via time-based serving-system eviction during inter-turn idle periods. §5.3
- 09Model switches are mostly reactive to rate limiting and compound a turn boundary into near-total cache loss, a 67 point drop to an average hit rate of 8%. Session-to-model pinning and proactive cache staging on the target model are needed to avoid this added cold-start cost. §5.4
- 10Context compaction affects 7.8% of sessions overall, typically dropping prompt tokens by over 70% and cache hit rate by 67%, a cache reset comparable in severity to a model switch. Incremental, prefix-preserving compaction strategies could maintain partial cache continuity. §6
- 11Tool usage is highly concentrated and heterogeneous. Read-heavy tools complete fast and succeed nearly universally, while execution tools such as run_build and run_command dominate the tail and fail more often; failed invocations take substantially longer, extending dependency chains and workflow resource residency. §7.1
- 12Tool execution is more parallel than LLM execution but remains largely sequential: 93% of tool batches invoke a single tool, while most parallel batches contain only 2 to 3 read-only operations. §7.2
- 13Tool and LLM overlap is pervasive by count, 97% of batches run inside an LLM window, but hides only 7.7% of aggregate tool wall-clock time. The long tail of long-running tools dominates total tool time, is largely un-overlapped, and drives session latency. §7.2
- 14User archetypes span a 50x range in per-turn token consumption, making uniform resource policies suboptimal. Archetype-aware SLOs, with longer cache retention for deep-loop users and aggressive eviction for chat-only and reader sessions, can reduce tail latency for power users while freeing aggregate memory. §8.3
- 15Resource idle time is bimodal. Intra-turn idle periods are short, 5.8s for containers and 1.2s for KV caches, and occur during autonomous agent execution, whereas cross-turn idle periods are minutes long, 243s and 172s, due to user idle time. Turn boundaries therefore provide a natural trigger for container eviction and KV-cache off. §9.1
Blog by #
Kiran Hombal
How this page was made
I didn’t redraw the paper’s figures by eye. The PDF stores every plot as vector geometry, so a script reads the drawing operators, recovers each plot’s axes from its clip rectangle, calibrates both axes against the tick labels, and writes out the real coordinates. Even so, these charts are reconstructions. I don’t have access to the underlying data, only to what the published figures encode, so I have tried to keep them as accurate as the source allows and every figure names the table or figure it came from. For more precise or accurate graphs, please look at the paper itself.